The needle deflection or the number shown on the digital display of a spectrophotometer is proportional to the transmittance of the solution. How do errors in transmittance readings affect the accuracy of solution concentration values? The concentration as a function of the transmittance is given by the equation

Let co be the true concentration and To the corresponding
transmittance, i.e. co = c(To). Suppose that the actual transmittance
measured is To + T, corresponding to the concentration co + c =
c(To + T). The error in the transmittance is T and that of the concentration is c.
By using a Taylor series expansion, and discarding all terms higher than T to the first power, it is possible to show that:

Dividing the second equation by the first gives us:

Values of -(TlnT)-1 as a function of T or A (A = -logT) are tabulated below.
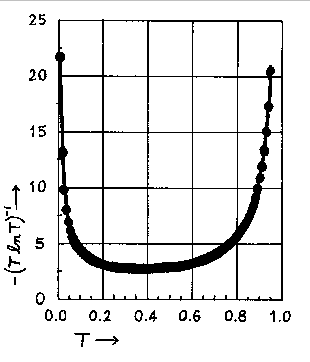
Below the tabulation one finds a plot of -(TlnT)-1 versus T.
The relative error in the concentration, for a given T, has its smallest value, when
T = 1/e = 0.368 or when A = 0.434. The minimum is not sharp and good results can be
expected
in a transmittance range from 0.2 to 0.6 or an absorbance range from 0.7 to 0.2. An inspection
of the graph below indicates that transmittance values of 0.1 and 0.8 are the outside limits
between which one can expect to obtain reasonably accurate results. These transmittance values
correspond to an absorbance range of 0.1 to 1.0 absorbance units. This is the rationale for
limiting your calibration curve to that absorbance range.
Values of -(T In T)-1 as a Function of T and A
| T | -(T ln T)-1 | A |
| 0.010 | 21.71 | 2.00 |
| 0.050 | 6.68 | 1.30 |
| 0.100 | 4.34 | 1.00 |
| 0.150 | 3.51 | 0.824 |
| 0.200 | 3.11 | 0.699 |
| 0.250 | 2.89 | 0.602 |
| 0.300 | 2.77 | 0.523 |
| 0.350 | 2.72 | 0.456 |
| 0.368 | 2.718 | 0.434 |
| 0.400 | 2.73 | 0.398 |
| 0.450 | 2.78 | 0.347 |
| 0.500 | 2.89 | 0.301 |
| 0.550 | 3.04 | 0.260 |
| 0.600 | 3.26 | 0.222 |
| 0.650 | 3.57 | 0.187 |
| 0.700 | 4.01 | 0.155 |
| 0.750 | 4.63 | 0.125 |
| 0.800 | 5.60 | 0.097 |
| 0.850 | 7.24 | 0.071 |
| 0.900 | 10.55 | 0.046 |
| 0.950 | 20.52 | 0.022 |
| 0.990 | 100.50 | 0.004 |
Graph of -(T ln T)-1 vs. T
