
Synonym: Transmission, T
Chapter 7, Absorption Spectroscopy, Principles and
Practice
Terms Employed
Radiant Power, P
Synonym: I for Intensity
Transmittance
Synonym: Transmission, T
Percent Transmittance:

Path Length: b
Concentration of solute: c
Absorptivity: a
Molar absorptivity: , if c is expressed in molarity.
The following derivation is based on the model of the absorption (shown in the figure at the
right)
of radiant power by the species in solution.
One says that the differential decrease -dP of radiant power for a passage through a differential distance dx is directly proportional to the concentration of the absorbing species and to the magnitude of the power available for absorption. This model then sets the stage for the derivation of the quantity Absorbance, A:
![]()
k is said to be a function of the molecular identity of the absorbing species, a bit of a "catch-all"
parameter. c is the concentration, P is the instantaneous power and dx is the differential change
of distance in the direction of power absorption.
Dividing both sides by P, we obtain
the definite integral of which yields

The details of the derivation will be exemplified in class, but suffice it to say here that the evaluation of the indefinite integral requires the assumption that when x = 0, P = Po and when
x = some defined value b, Po has diminished to some smaller value P.
A logarithm changes sign when its argument is inverted, so effecting this change and a slight
rearrangement gives us

In the early days of spectrophotometers, the fraction of radiant power P/Po getting through a particular optical cell was easy to measure simply as the ratio of the final intensity compared to the initial intensity. Hand calculators which produce instantaneous values of natural logarithms were not yet even a dream but people did have books of logarithms to the base 10 to which they referred often when making calculations. Thus the equation above for them was more convenient if converted to the following form
The value of k is dependent upon the units of b and c. In the most general final result of this derivation we allow k/2.303 to equal the absorptivity, a, so that the equation becomes

In the case that concentration is measured in molarity, we call "a" the molar
absorptivity and give
it the symbol epsilon, or , so that the equation takes the form

This equation is called Beer's Law for the investigator who first
recognized the simple
relationship between the logarithm of the ratio of Po and P and the concentration.
Beer's Law also applies to mixtures of non-interacting species
![]()
which says that if individual solutions of substances 1,2 and 3, having concentrations
c1, c2 and c3
produce, at the same wavelength, absorbances A1, A2 and
A3, respectively, the total absorbance of
a single solution of substances 1,2 and 3, having concentrations c1, c2
and c3 in that solution
would produce, at the same wavelength, an absorbance ATOTAL =
A1
+ A2 + A3. This prediction
has been verified experimentally.
Limitations on Beer's Law
Some deviations in linearity are connected with changes in absorptivity with wavelength and
the
specificity of the instrument in being able to isolate the smallest increment of absorbing
wavelengths. Others are a function of the absorbing molecules and their interactions in solution.
In the first case, if the increment of wavelengths measured by the instrument is small and the
molar absorptivity of the species being observed is near the maximum then any change in the
molar absorptivity in this region is small and Beer's Law is obeyed. If, however, species are
being
observed in a region where there is a noticeable gradient in the molar absorptivity
and the
increment of wavelengths is large, second- and higher order relationships between absorbance
and
concentration begin to be observed, that is non-linear perturbations in Beer's Law are observed.
In the second case, as concentration of the species being observed increases there is a greater
probability in interactions between the absorbing molecules, and a change (usually downward) in
the absorbance. Any interaction likely interferes with the
electronic band structure in the absorbing species and and
energy absorption levels change with a resulting exhibition
of a non-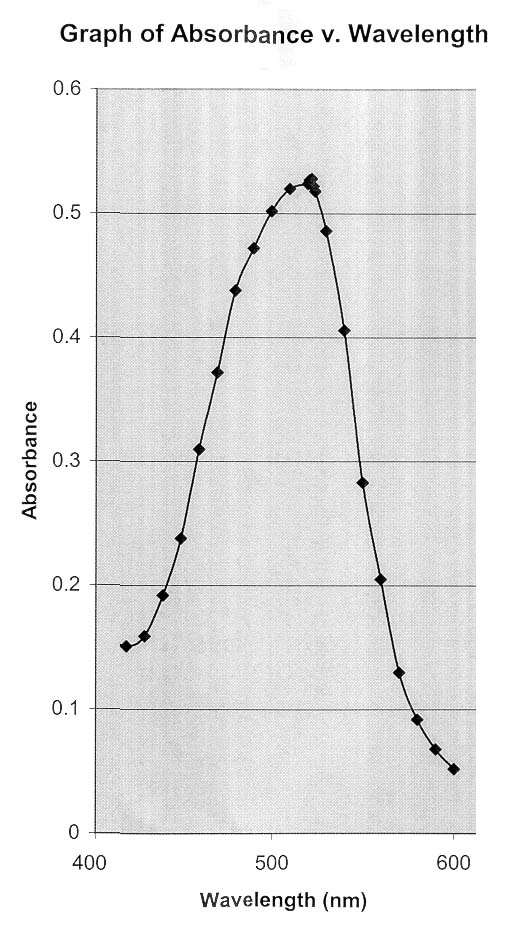
linear perturbation of Beer's Law.
For these reasons, dilute solutions are used and the
absorbance is measured at a wavelength referred to as max
. max is found by plotting absorbance vs. wavelength, as
shown in the diagram of the absorbance of the iron-bipyridyl complex at right. (Thanks to Ms.
Khanh Nguyen
for sharing her experimental plot with us)
Note that at max there is no gradient in absorbance with
wavelength. A change in absorbance is negligible over any
reasonably small increment of wavelength.
A brief Journey into the Theory of
Absorbance
The model which helps us to explain absorbance is based
on quantized energy states observed in molecular species.
These states come in three forms: electronic, vibrational
and rotational. A photon of sufficient energy can interact
with a molecule to "bump" it into a higher energy level or energy state. Specialists in the field
speak of electronic, vibrational and rotational energy levels but
one also hears the terms
vibrational modes and rotational
modes. These terms help specialists in the field to explain the
complexity of observed spectra. Molecular energy transitions extend from the microwave at the
low energy end of the electromagnetic spectrum to the ultraviolet at the higher energy end. In
very broad terms, electronic energy transitions are effected by photons whose energies are
characteristic of the visible and ultraviolet parts of the spectrum, vibrational changes by infrared
and purely rotational changes occur by photons whose energies lie in the microwave region of the
spectrum.
The model says that absorption of electromagnetic energy comes about if a photon of an energy sufficiently close to an allowed energy transition (electronic, vibrational or rotational) of a molecule, M, passes sufficiently close to a molecule or ion to bring about a change in the wave equation to a higher energy level. Absorbance of this energy results in an excited state, M*. The excited state then emits subsequent photons dropping down to intermediate energy levels. The standard equation which describes this action is
![]()
When one considers that the organization of life depends on the input of energy to give rise
to
higher organization followed by subsequent emission of energy in smaller units but often coupled
to reactions needing the smaller units of energy, as the manifestations of higher organization
change shape, composition and whose energy spontaneously drops to lower energy states, the
equation above may have implications more far reaching and profound than that which will be
covered here.
Each step indicated above, after the initial input of h, depends on the release of energy caused
by
events within the excited molecule and are not well understood. We say simply that there is
some
characteristic time, a half-life, during which half of the excited molecules at some level decay to
a
lower level. The model used for this is the same as that applied to spontaneous radioactive
decay.
In the case of molecules which have been raised to excited energy states, the half life
characteristically varies between a billionth of a second and ten billionths of a second.
The deep red-violet color of the MnO4- ion is caused by the
absorbance of energy in the green
region of the visible spectrum. The model used to describe the mechanism of the energy
absorbance is that of transitions of energy levels of delocalized electrons involved in the bonding
of the Mn atom in the complex ion. This is an electronic energy transition.
Gaseous HCl absorbs energy characteristic of the energy levels produced by resonance states
of
its covalent bond which in turn is related to the force constant of the bond and the mass of each
atom. The model applied in this case is that of a vibrating spring (harmonic oscillator). The
differences in those resonance states fall in the far infrared region of the electromagnet spectrum.
Water molecules in the gaseous state are free to rotate around any of three orthogonal axes. That such molecules can absorb energy consistent with a rigid rotor model given allowed energy levels suggests a phenomenon similar to that of electronic and vibrational energy transitions. Water in the liquid state suffers continuous intermolecular interactions owing to the close proximity of other water molecules. The allowed energy levels are said to be somewhat "fuzzed out" allowing energy absorbance within whole bands of energy in the microwave region of the spectrum. The microwave oven takes advantage of such a band structure. The frequency of a microwave oven is 2.45 GHz, and, as it turns out, NOT exactly centered on a resonant frequency for the water molecule. Had a resonant frequency been selected, most of the radiation would be absorbed by water molecules at the surface and the interior of the food would remain cold. Lower frequencies would penetrate better but not cook as well. Higher frequencies would not penetrate as well. 2.45 Ghz was chosen because of non-interference with assigned electromagnetic spectrum assignments for communication, convenience in implementation and reasonable penetration of the microwave energy into the food.
The absorbance spectrum of water is
illustrated here with the x-axis scaled in a
logarithmic fashion in order to include a
huge range of frequencies. So as better to
orient you to the "real-world" uses of the
spectrum, the image shows a frequency
range starting around the amplitude
modulation (AM) radio transmission band
and progressing through the FM band,
microwave, infrared, visible and ultraviolet
regions of the spectrum. Note that at the
frequencies shown here below 10-3
gigahertz, water is a reasonably transparent
liquid. Electromagnetic radiation in that
portion of the spectrum is not absorbed.
There is increasing absorption as the
frequency of radiation progresses through
the microwave and IR regions. That is to
say, water becomes an opaque liquid. Then
it becomes transparent in the visible region
and goes opaque once again in the
ultraviolet region.
The table below gives an example for each of the energy transitions described above.
| Molecule/
species |
Formula | Absorbing
wavelength |
Frequency |
| Permanganate | MnO4- | 500 nm
(electronic) |
600,000 GHz |
| Hydrogen
chloride |
HCl | ~0.04 cm
(vibrational) |
750 GHz |
| Water | H2O | ~12 cm
(rotational) |
2.45 GHz |
Every molecular species has its own characteristic absorption frequencies but the rule that
electronic transitions occur in the visible and ultraviolet, vibrational transitions in the infrared
and
rotational transitions in the microwave regions of the electromagnetic spectrum is generally
followed.
(This chapter is incomplete. Additional topics connected with spectroscopy will be introduced as needed in class.)