Revised November 8, 2024
For your amusement and amazement and to provoke questions and discussion, here are three diagrams of energy flow in the United States first made available in 1970, 2005 and 2023.*
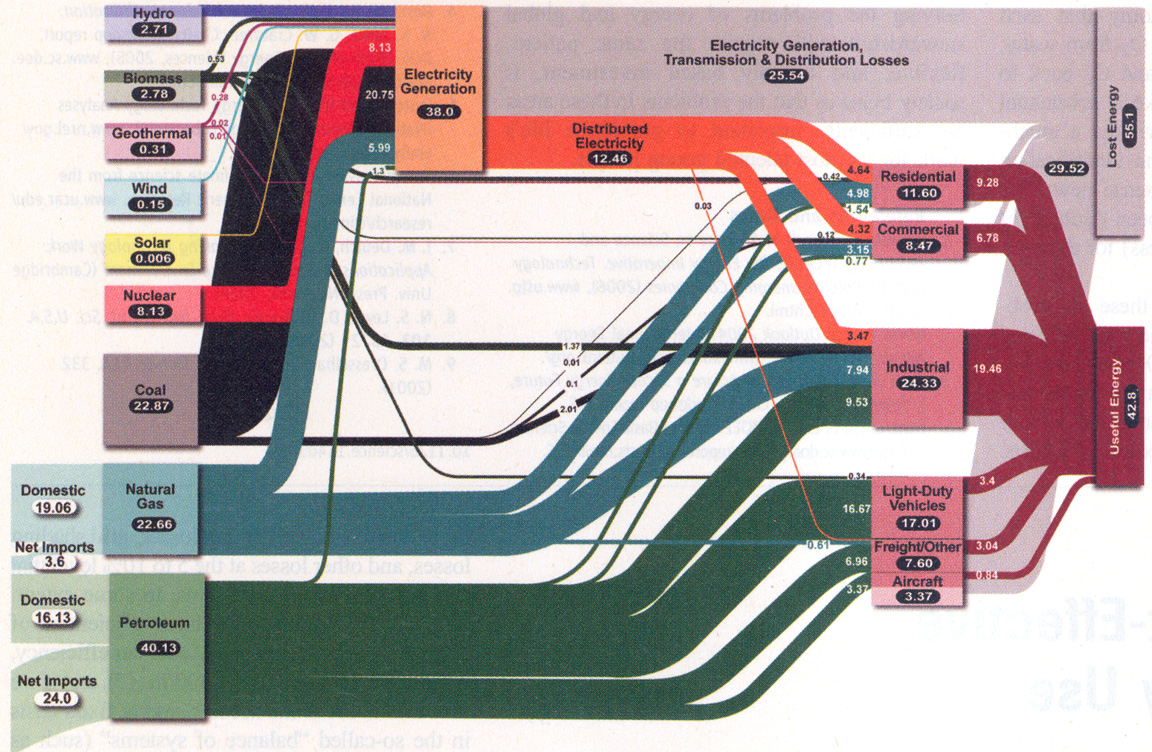
The numbers in each are in units of quads, a quad being one quadrillion British Thermal Units (BTU). One quad = 1015 BTUs. A BTU is the amount of energy required to raise the temperature of one pound of water one degree Fahrenheit. One quad = 1.055 exajoules (1018 joules). Each diagram has a resolution sufficiently high so as, on enlargement, to allow the numbers and labels to be read clearly.
1970 Energy Flow

2005 Energy Flow
2023 Energy Flow
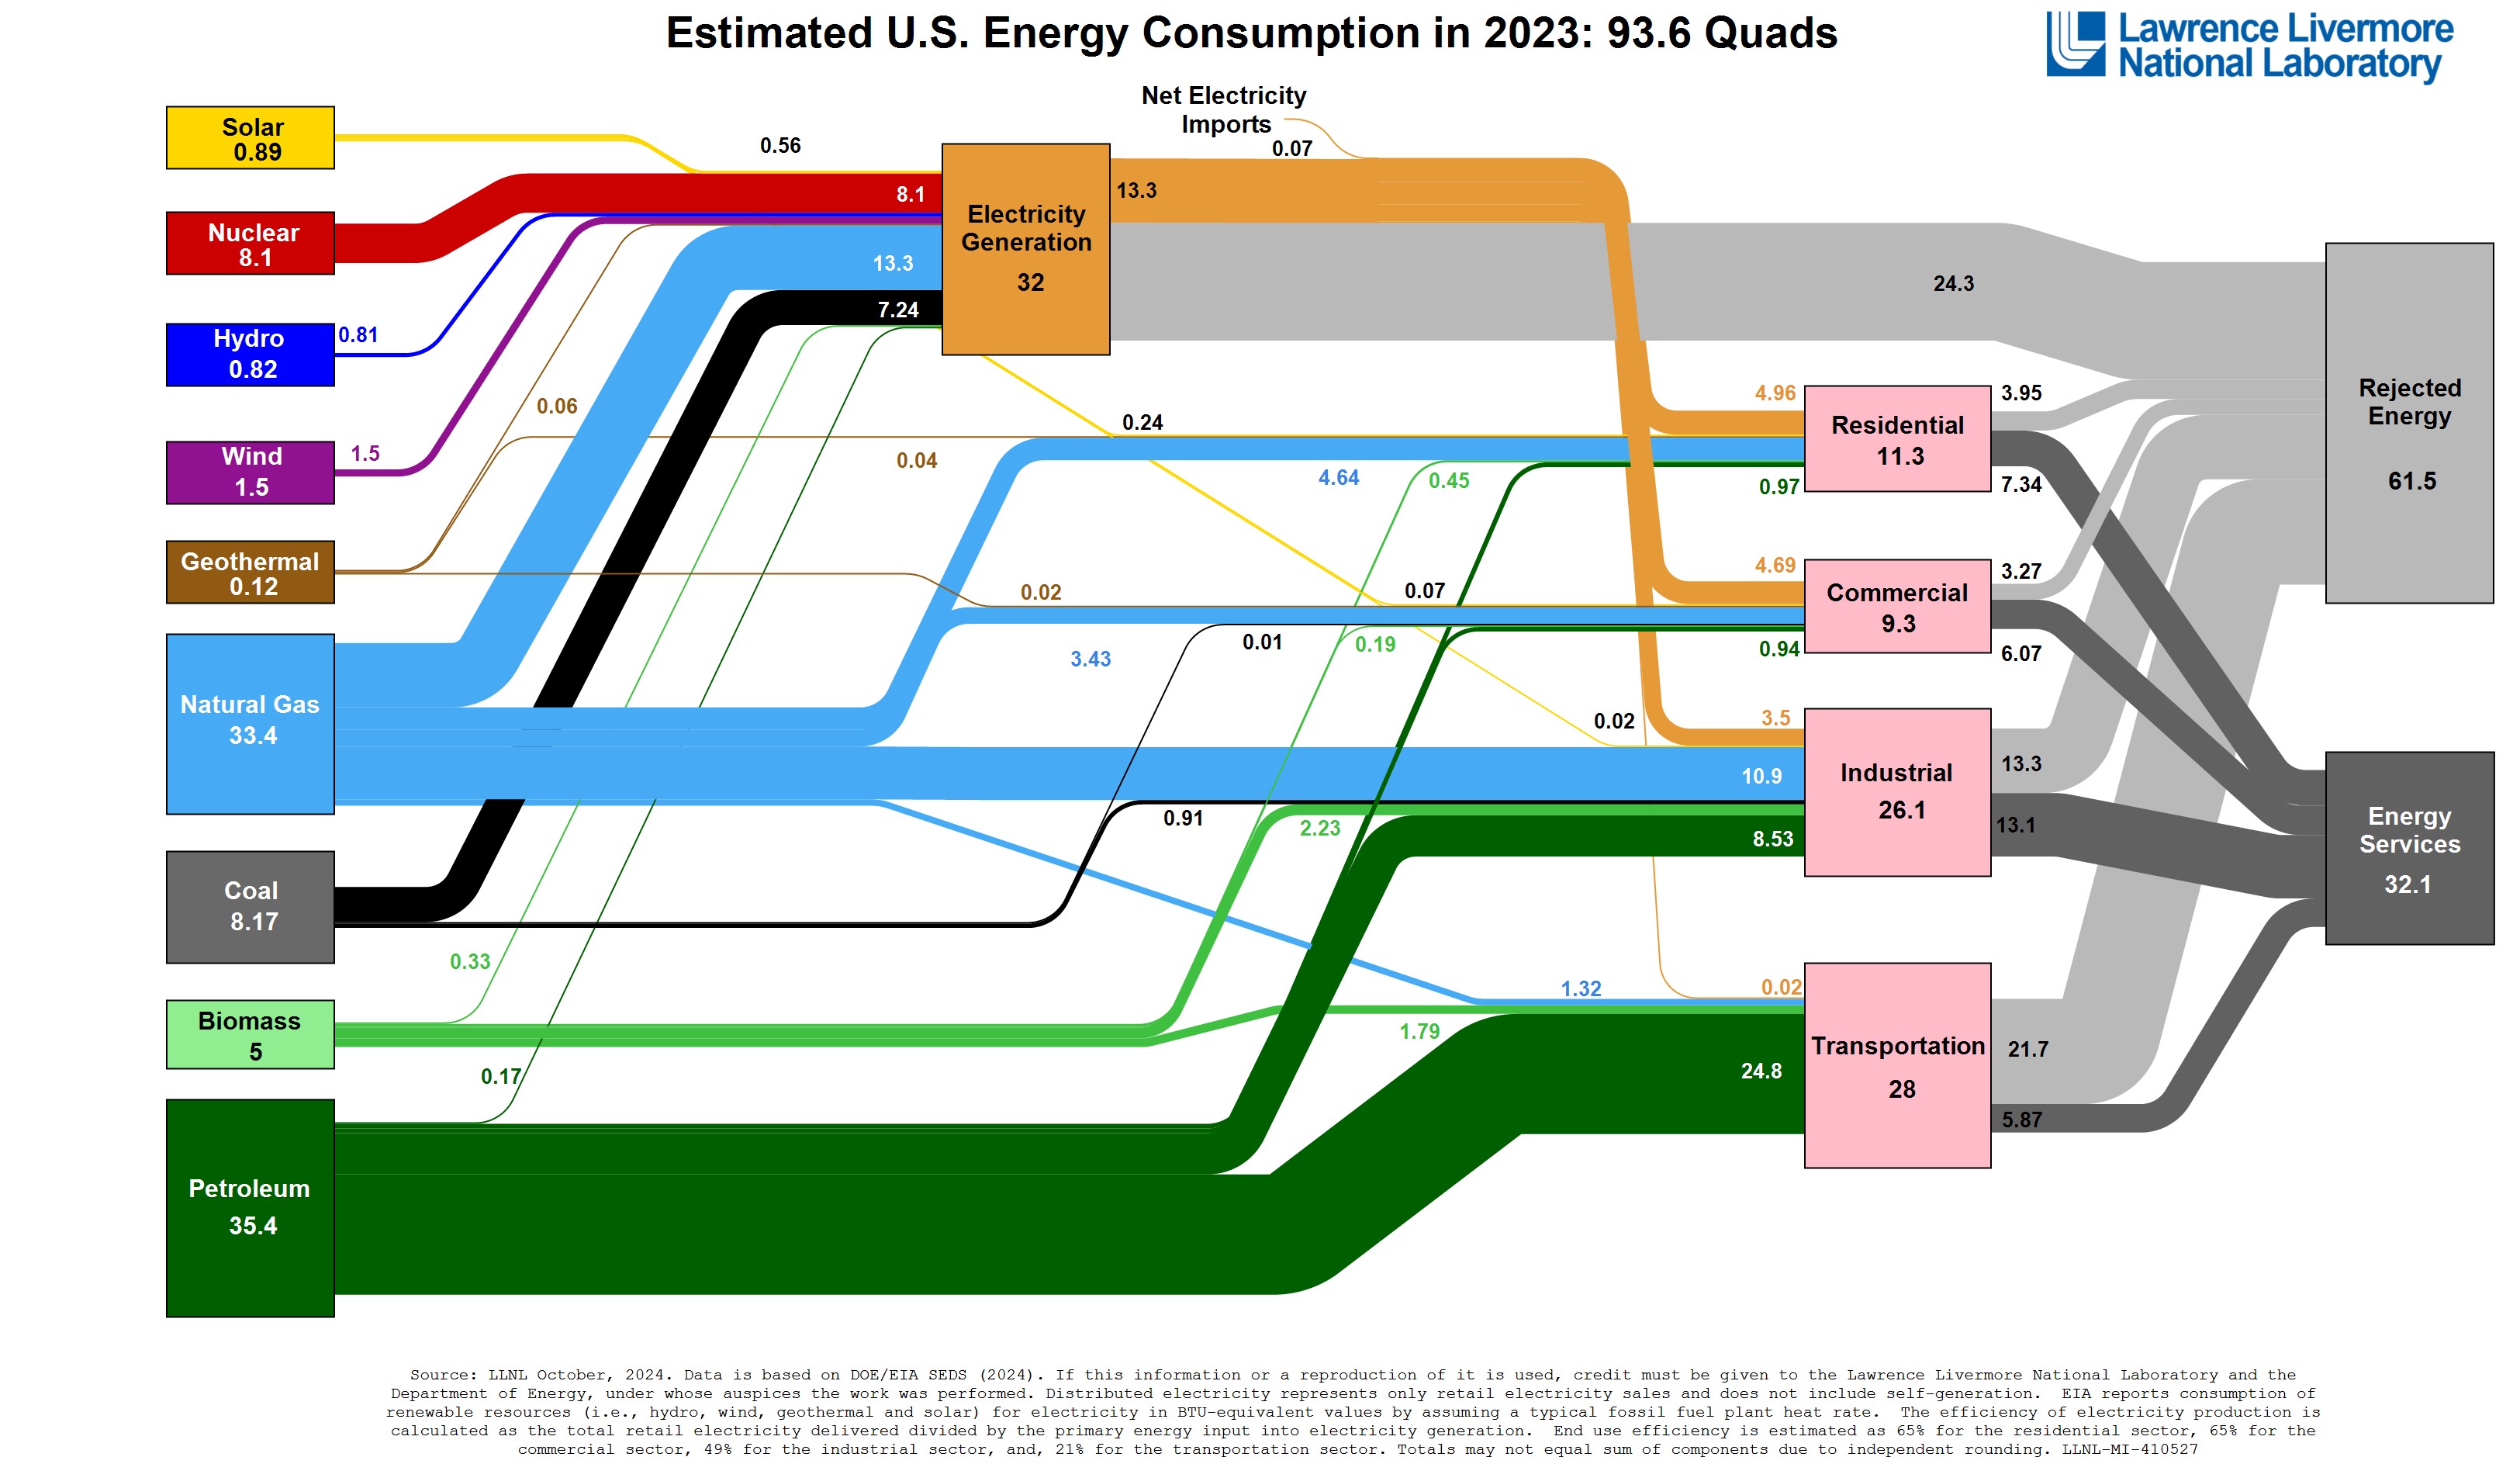
*The first comes from “The Economy, Energy, and the Environment: A Background Study Prepared for the Use of the Joint Economic Committee, Congress of the United States.” Environmental Policy Division, Legislative Reference Service, Library of Congress. U.S. Government Printing Office, 1970. The second was prepared by Lawrence Livermore National laboratory, University of California, and the U.S. Department of Energy in 2005. The third was prepared by the U.S. Energy Information Administration (EIA) in 2023.
Send a message to Oliver about this page? Click here.