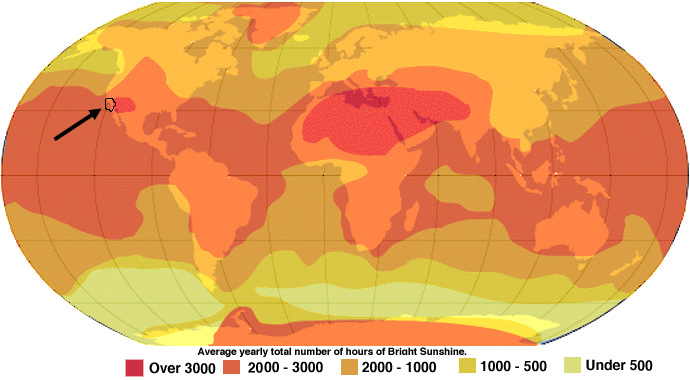
 The decision to install photovoltaic cell panels hinges on where one lives. The amount
of sunlight
as determined by the climate of one's location and the ability to receive the direct rays of the
sun
when it
is shining helps one to decide if it makes sense to install the panels. On the left and right
are images showing available sunlight for the United States and the world respectively.
Although
our location
appears to be ideal because of the available sunlight per year, in actual fact our distance from
the
Pacific
Ocean is only 12 km and coastal fog is a problem part of the year. On the average, the
amount of
sunlight
we get is limited to between 5 and 8 hours per day throughout the year (see the blue strip
along
the coast in the left image in front of the arrow tip).
The decision to install photovoltaic cell panels hinges on where one lives. The amount
of sunlight
as determined by the climate of one's location and the ability to receive the direct rays of the
sun
when it
is shining helps one to decide if it makes sense to install the panels. On the left and right
are images showing available sunlight for the United States and the world respectively.
Although
our location
appears to be ideal because of the available sunlight per year, in actual fact our distance from
the
Pacific
Ocean is only 12 km and coastal fog is a problem part of the year. On the average, the
amount of
sunlight
we get is limited to between 5 and 8 hours per day throughout the year (see the blue strip
along
the coast in the left image in front of the arrow tip).
 Here is another image of the continental United States with a legend including units of
kilowatt
hours per square meter per day.
Here is another image of the continental United States with a legend including units of
kilowatt
hours per square meter per day.
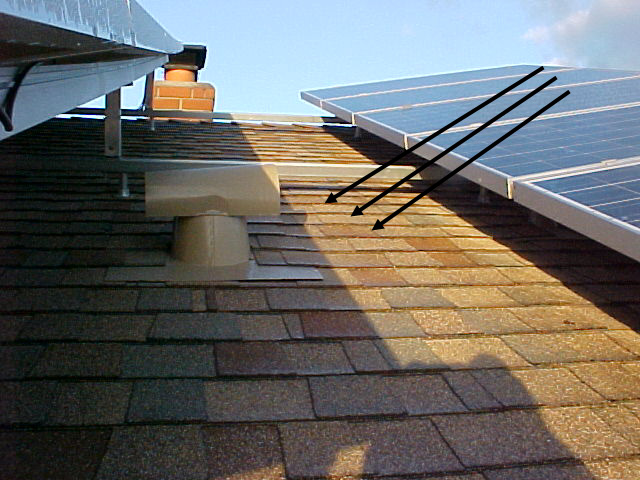
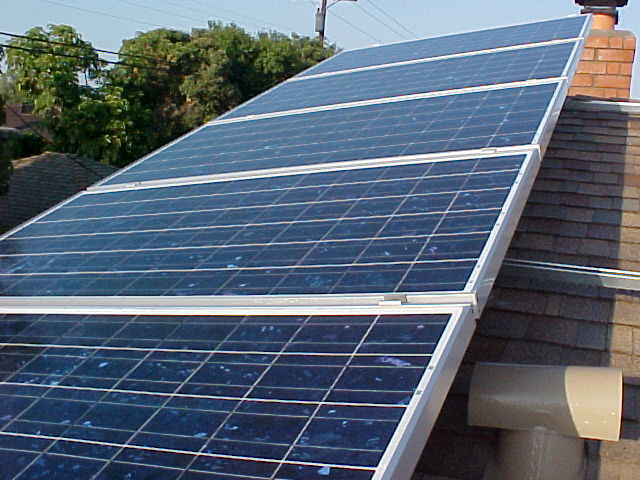
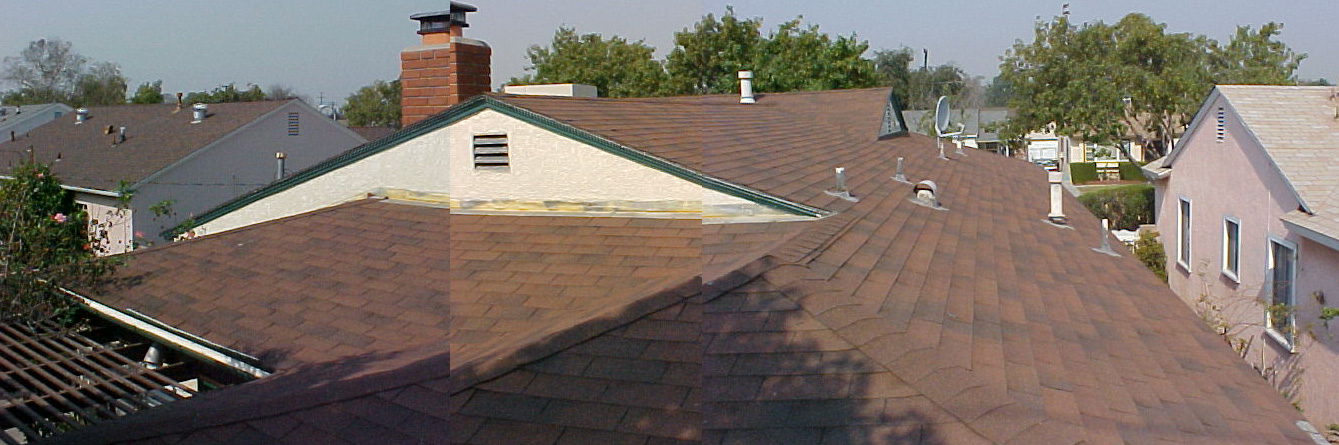 A roof sloping toward the south in full view of the sky would be ideal. However, our roof
line
slopes toward the
east and the
west. There is a chimney near the peak, as you can see.
A roof sloping toward the south in full view of the sky would be ideal. However, our roof
line
slopes toward the
east and the
west. There is a chimney near the peak, as you can see.
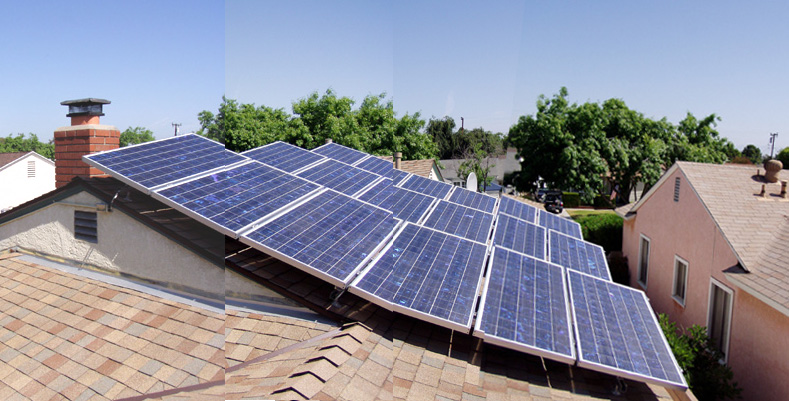 The panels have to be installed where there are no shadows during the day, so we installed
our
2.5
kilowatt system on the east-sloping roof with an additional tilt toward the south. There are
actually 18 panels each rated at 165 watts which brings the system to a theoretical maximum
power output of 2970 watts or 2.97 kilowatts. The rating of 2.5 kilowatts may be due to the
installing company knowing that the tilt of our panels would be less than ideal. Maximum
output occurs around 11 am each day that the sun shines.
The panels have to be installed where there are no shadows during the day, so we installed
our
2.5
kilowatt system on the east-sloping roof with an additional tilt toward the south. There are
actually 18 panels each rated at 165 watts which brings the system to a theoretical maximum
power output of 2970 watts or 2.97 kilowatts. The rating of 2.5 kilowatts may be due to the
installing company knowing that the tilt of our panels would be less than ideal. Maximum
output occurs around 11 am each day that the sun shines.
 Miscellaneous Observations
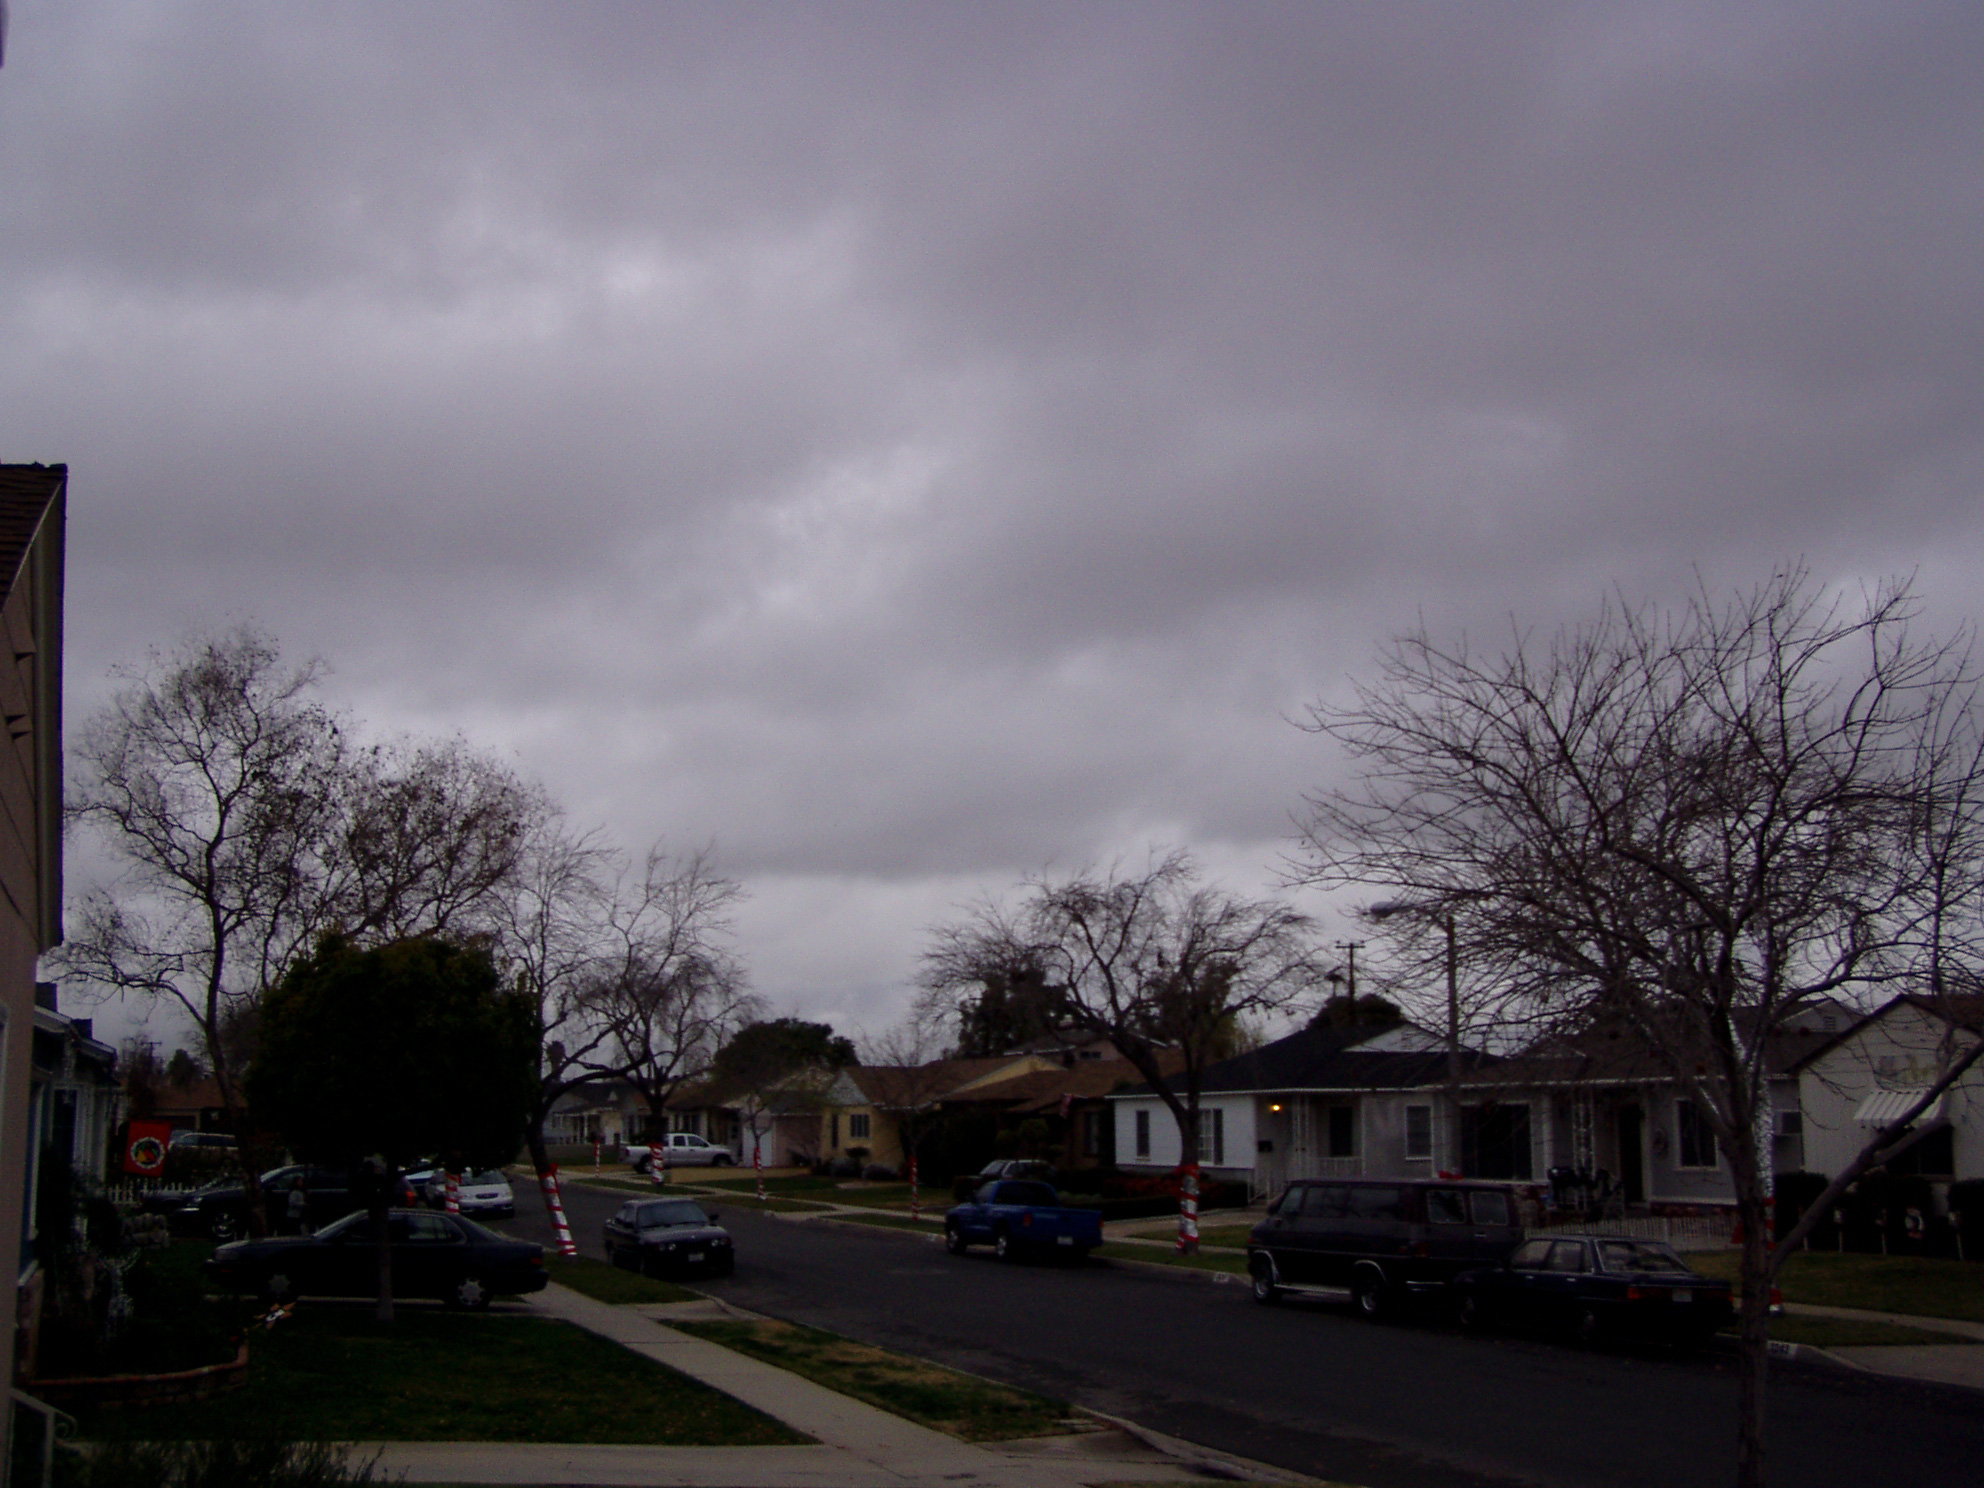
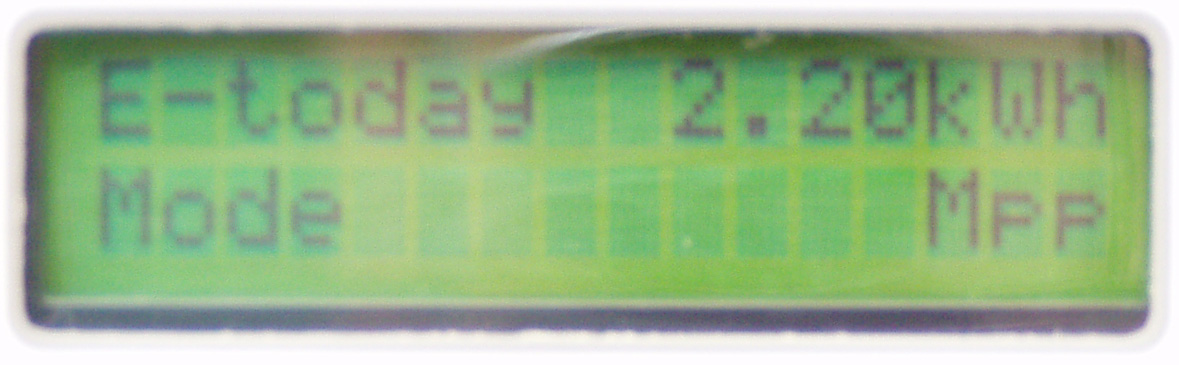
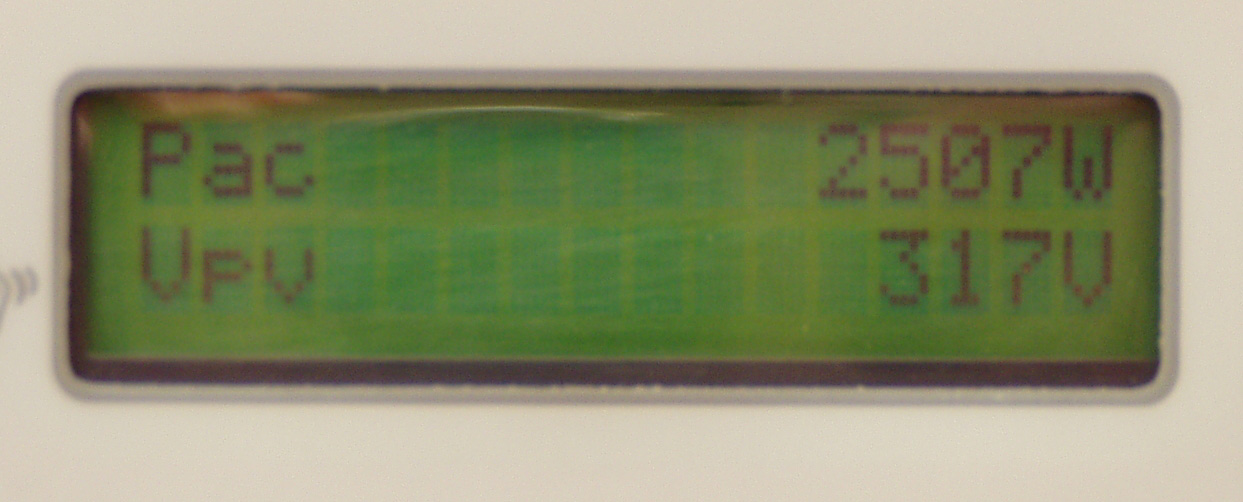 On some partially cloudy days during the early spring a curious observation can be made as
the
sun periodically peeks through the clouds. Here are two images on April 22, 2006. Except
for
the occasional gaps in the clouds, this was NOT a typical sunny day in southern California.
But
take a look at the meter: 2507 Watts! Is it favorable atmospheric conditions which allow a
large
amount of UV light to arrive at the panels or is it the added illumination of reflected light
from
the
clouds which increases the power output to an "as advertised" level?
On some partially cloudy days during the early spring a curious observation can be made as
the
sun periodically peeks through the clouds. Here are two images on April 22, 2006. Except
for
the occasional gaps in the clouds, this was NOT a typical sunny day in southern California.
But
take a look at the meter: 2507 Watts! Is it favorable atmospheric conditions which allow a
large
amount of UV light to arrive at the panels or is it the added illumination of reflected light
from
the
clouds which increases the power output to an "as advertised" level?
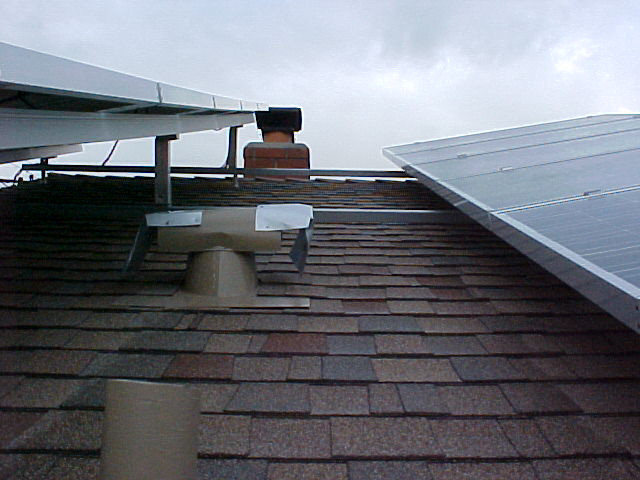 Structural modifications of any kind carry the risk of unintended consequences. Our
installation
caused a leak through the bathroom vent during heavy rain as a result of runoff onto the roof
and subsequent
splashing into the vent. The vent was modified by adding a shield, as shown. Ugly though it
may
be, it did the trick as demonstrated by another rainstorm shortly after its installation.
Structural modifications of any kind carry the risk of unintended consequences. Our
installation
caused a leak through the bathroom vent during heavy rain as a result of runoff onto the roof
and subsequent
splashing into the vent. The vent was modified by adding a shield, as shown. Ugly though it
may
be, it did the trick as demonstrated by another rainstorm shortly after its installation.
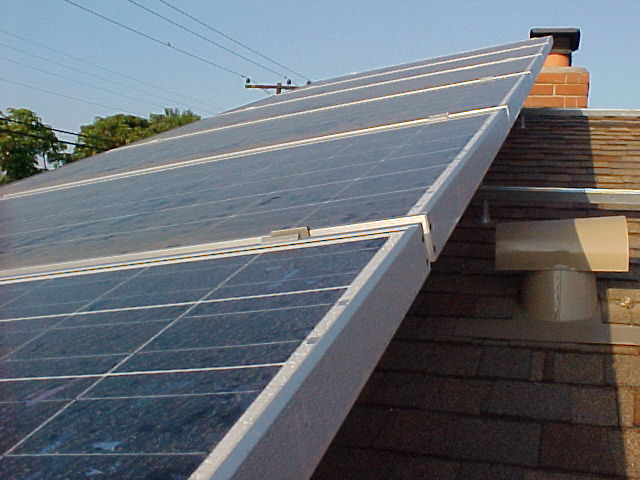
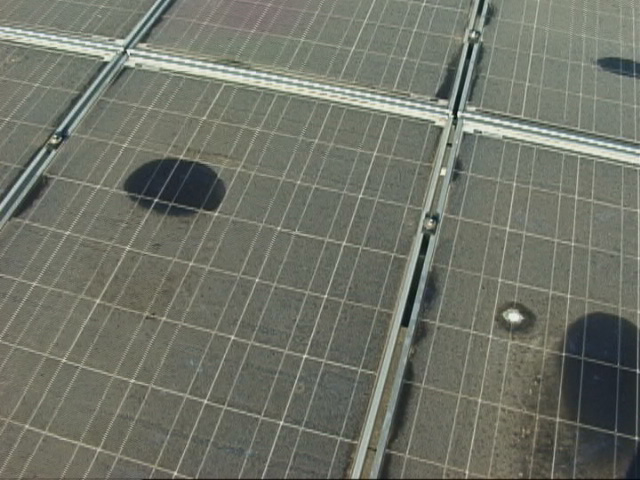
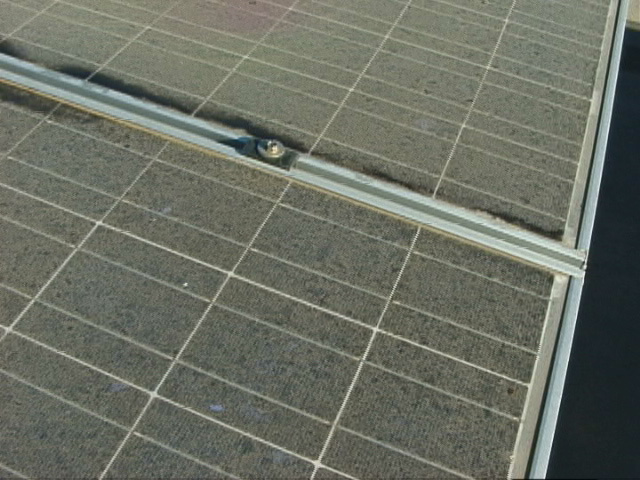
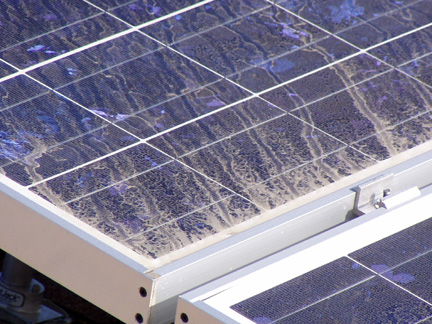 The bad
news is that over time in an urban area where there is a lot of dustfall, the efficiency drops.
In the Los Angeles area several
months can go by without rain. These images show what happens after such a
period. We have found it advisable to do a once-a-month rinsing of the panels to make them
sparkling clean and to bring them back to maximum
efficiency.
The bad
news is that over time in an urban area where there is a lot of dustfall, the efficiency drops.
In the Los Angeles area several
months can go by without rain. These images show what happens after such a
period. We have found it advisable to do a once-a-month rinsing of the panels to make them
sparkling clean and to bring them back to maximum
efficiency.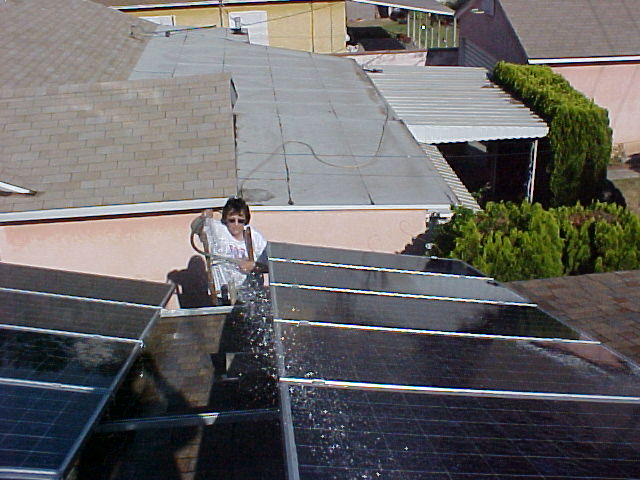
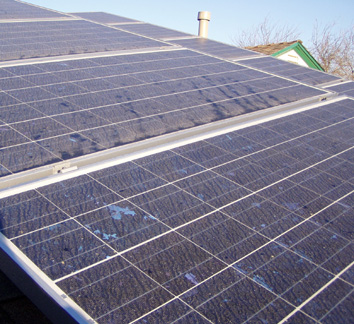 Here's an image taken of the panels after two months without rain. My guess is that the drop
in
power output was somewhere around 10%.
Here's an image taken of the panels after two months without rain. My guess is that the drop
in
power output was somewhere around 10%.
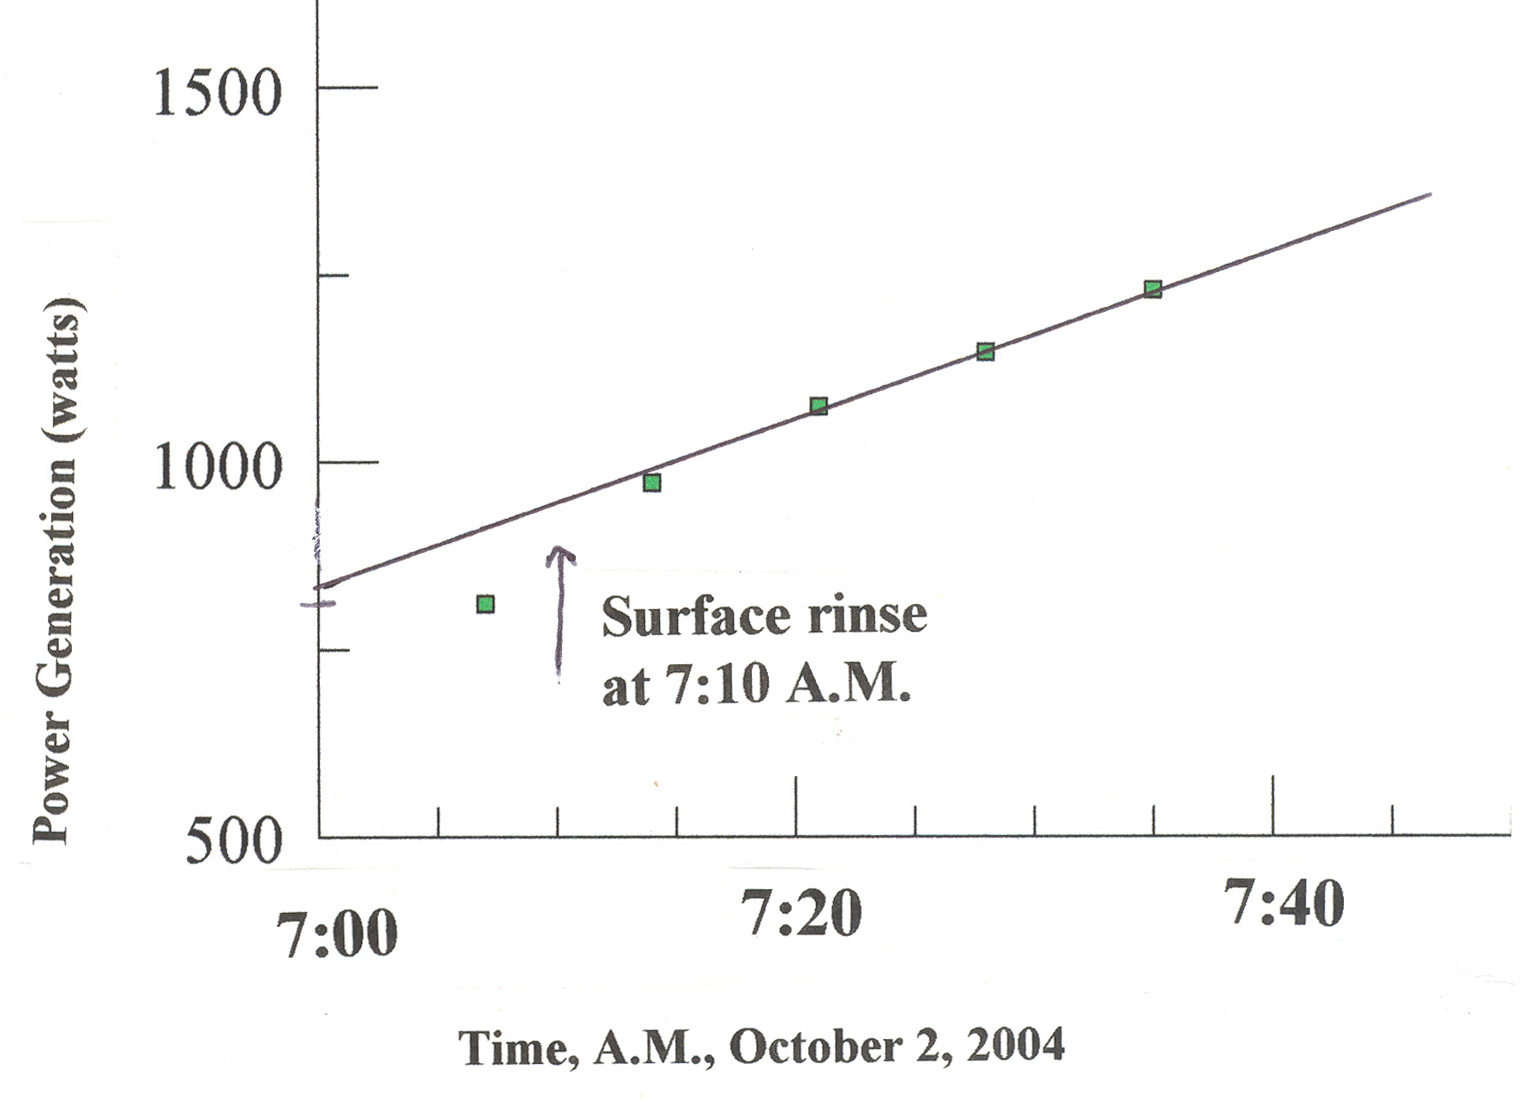 The first point in the graph on the left shows the output from panels which had been allowed
to
collect
dust for a month. After rinsing the panels, the output was monitored in 7 minute increments
following the first measurement. The "best fit" line crosses the time of the first measurement
at
an
output of 905 watts. The measured output of the dirty panels at that time was 811 watts or
around 10%
less than that which might have been generated at that time by clean panels.
The first point in the graph on the left shows the output from panels which had been allowed
to
collect
dust for a month. After rinsing the panels, the output was monitored in 7 minute increments
following the first measurement. The "best fit" line crosses the time of the first measurement
at
an
output of 905 watts. The measured output of the dirty panels at that time was 811 watts or
around 10%
less than that which might have been generated at that time by clean panels.
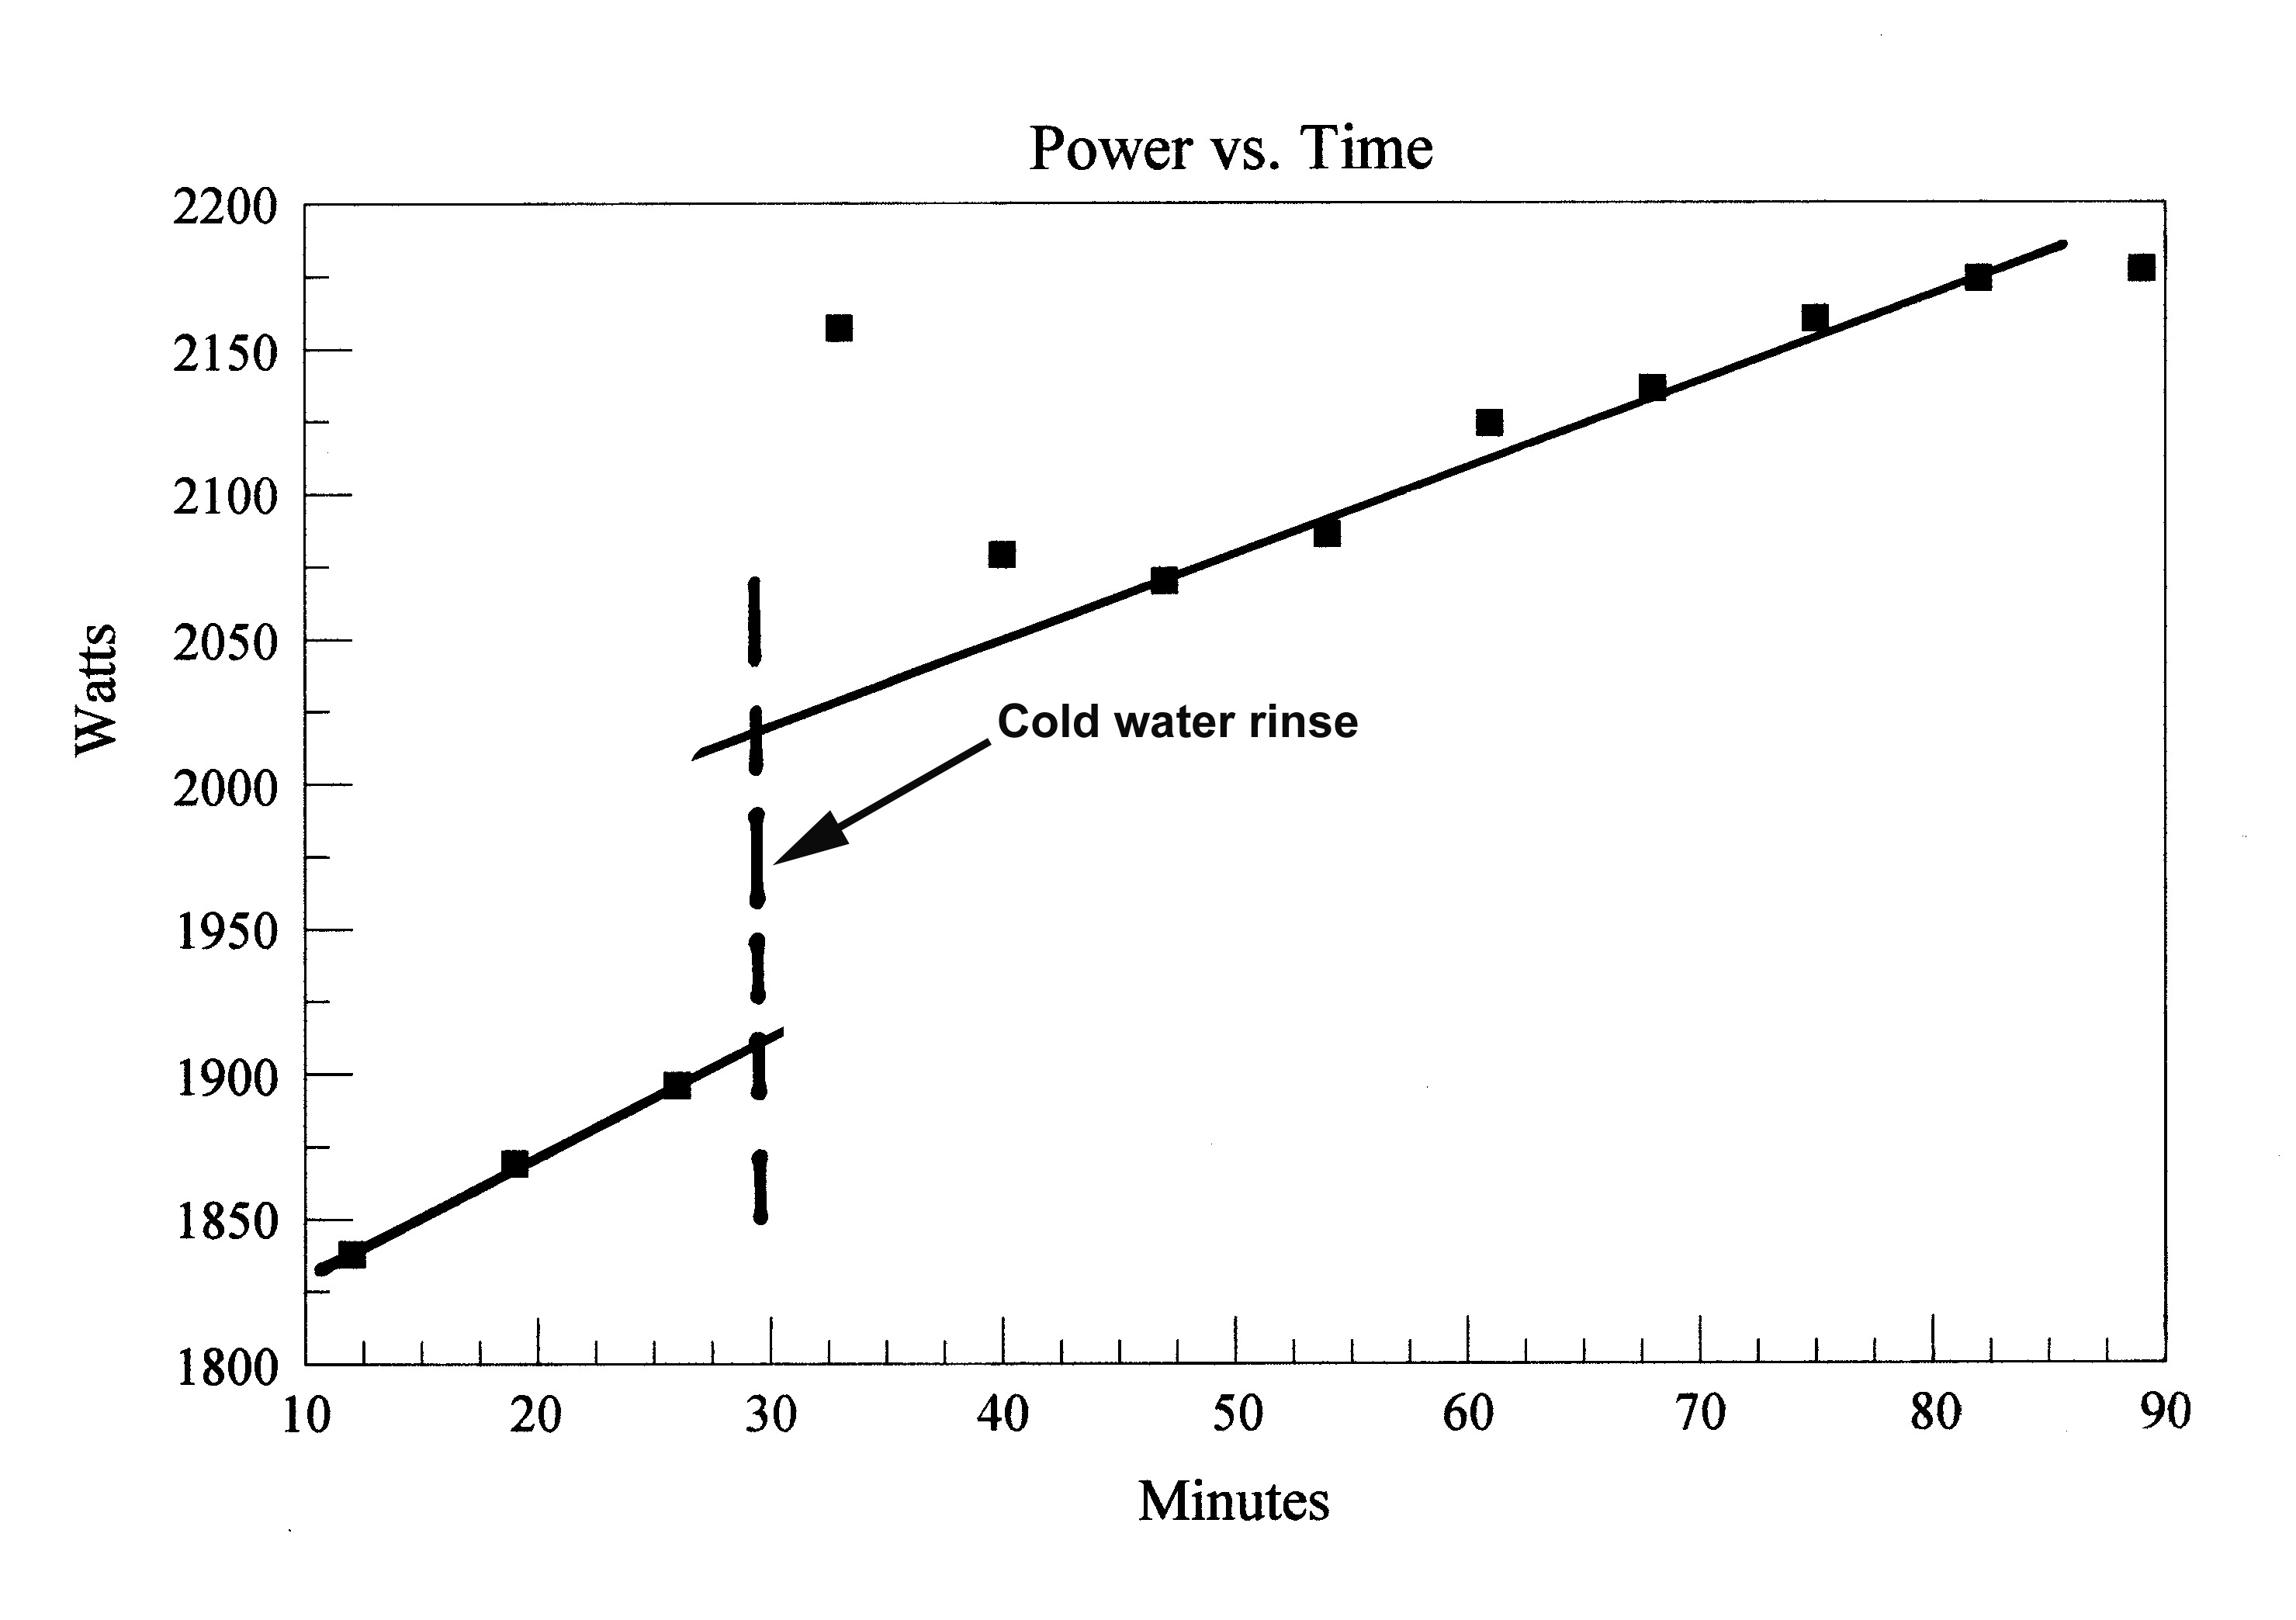
 Here's another one a bit more dramatic. The minutes from 3 to 45 were minutes following
10am,
August 5, 2005. It was a cloudless and hot summer morning. There had been no rain for two
months. Readings were taken every seven minutes. The first three readings were taken, the
panels were then given a cold water rinse and four additional readings were taken. Note the
large
increase in output for the fourth reading and the subsequent drop-off. I assume that the larger
reading is characteristic of the colder operating temperature immediately after the cold water
rinse. There appears to be a 15% increase after the rinse.
Here's another one a bit more dramatic. The minutes from 3 to 45 were minutes following
10am,
August 5, 2005. It was a cloudless and hot summer morning. There had been no rain for two
months. Readings were taken every seven minutes. The first three readings were taken, the
panels were then given a cold water rinse and four additional readings were taken. Note the
large
increase in output for the fourth reading and the subsequent drop-off. I assume that the larger
reading is characteristic of the colder operating temperature immediately after the cold water
rinse. There appears to be a 15% increase after the rinse.
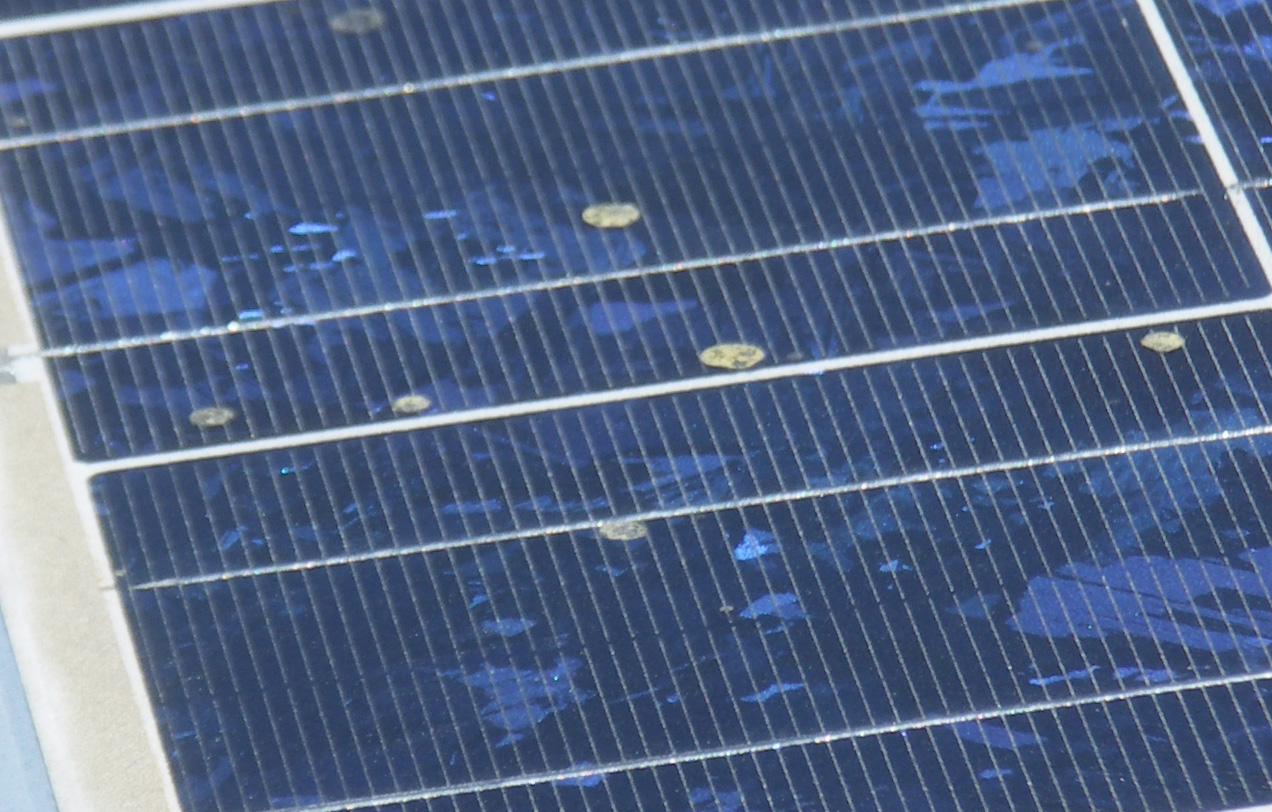 All kinds of stuff falls routinely from the sky: meteorites, cosmic dust and used satellites for
starters. At our house in southern California and near an airport we get little spots of yellow
gunk which produces opaque spots on the solar panels. It has the consistency of dust particles
mixed with oil judging from the way it scrapes off the panels. Fortunately the ultraviolet light
breaks enough of the chemical bonds in whatever binds the particles together to allow them
finally to sluff off during repeated rinsings. Still, they do represent a potential fall-off of
energy
generated by one's installation.
All kinds of stuff falls routinely from the sky: meteorites, cosmic dust and used satellites for
starters. At our house in southern California and near an airport we get little spots of yellow
gunk which produces opaque spots on the solar panels. It has the consistency of dust particles
mixed with oil judging from the way it scrapes off the panels. Fortunately the ultraviolet light
breaks enough of the chemical bonds in whatever binds the particles together to allow them
finally to sluff off during repeated rinsings. Still, they do represent a potential fall-off of
energy
generated by one's installation. 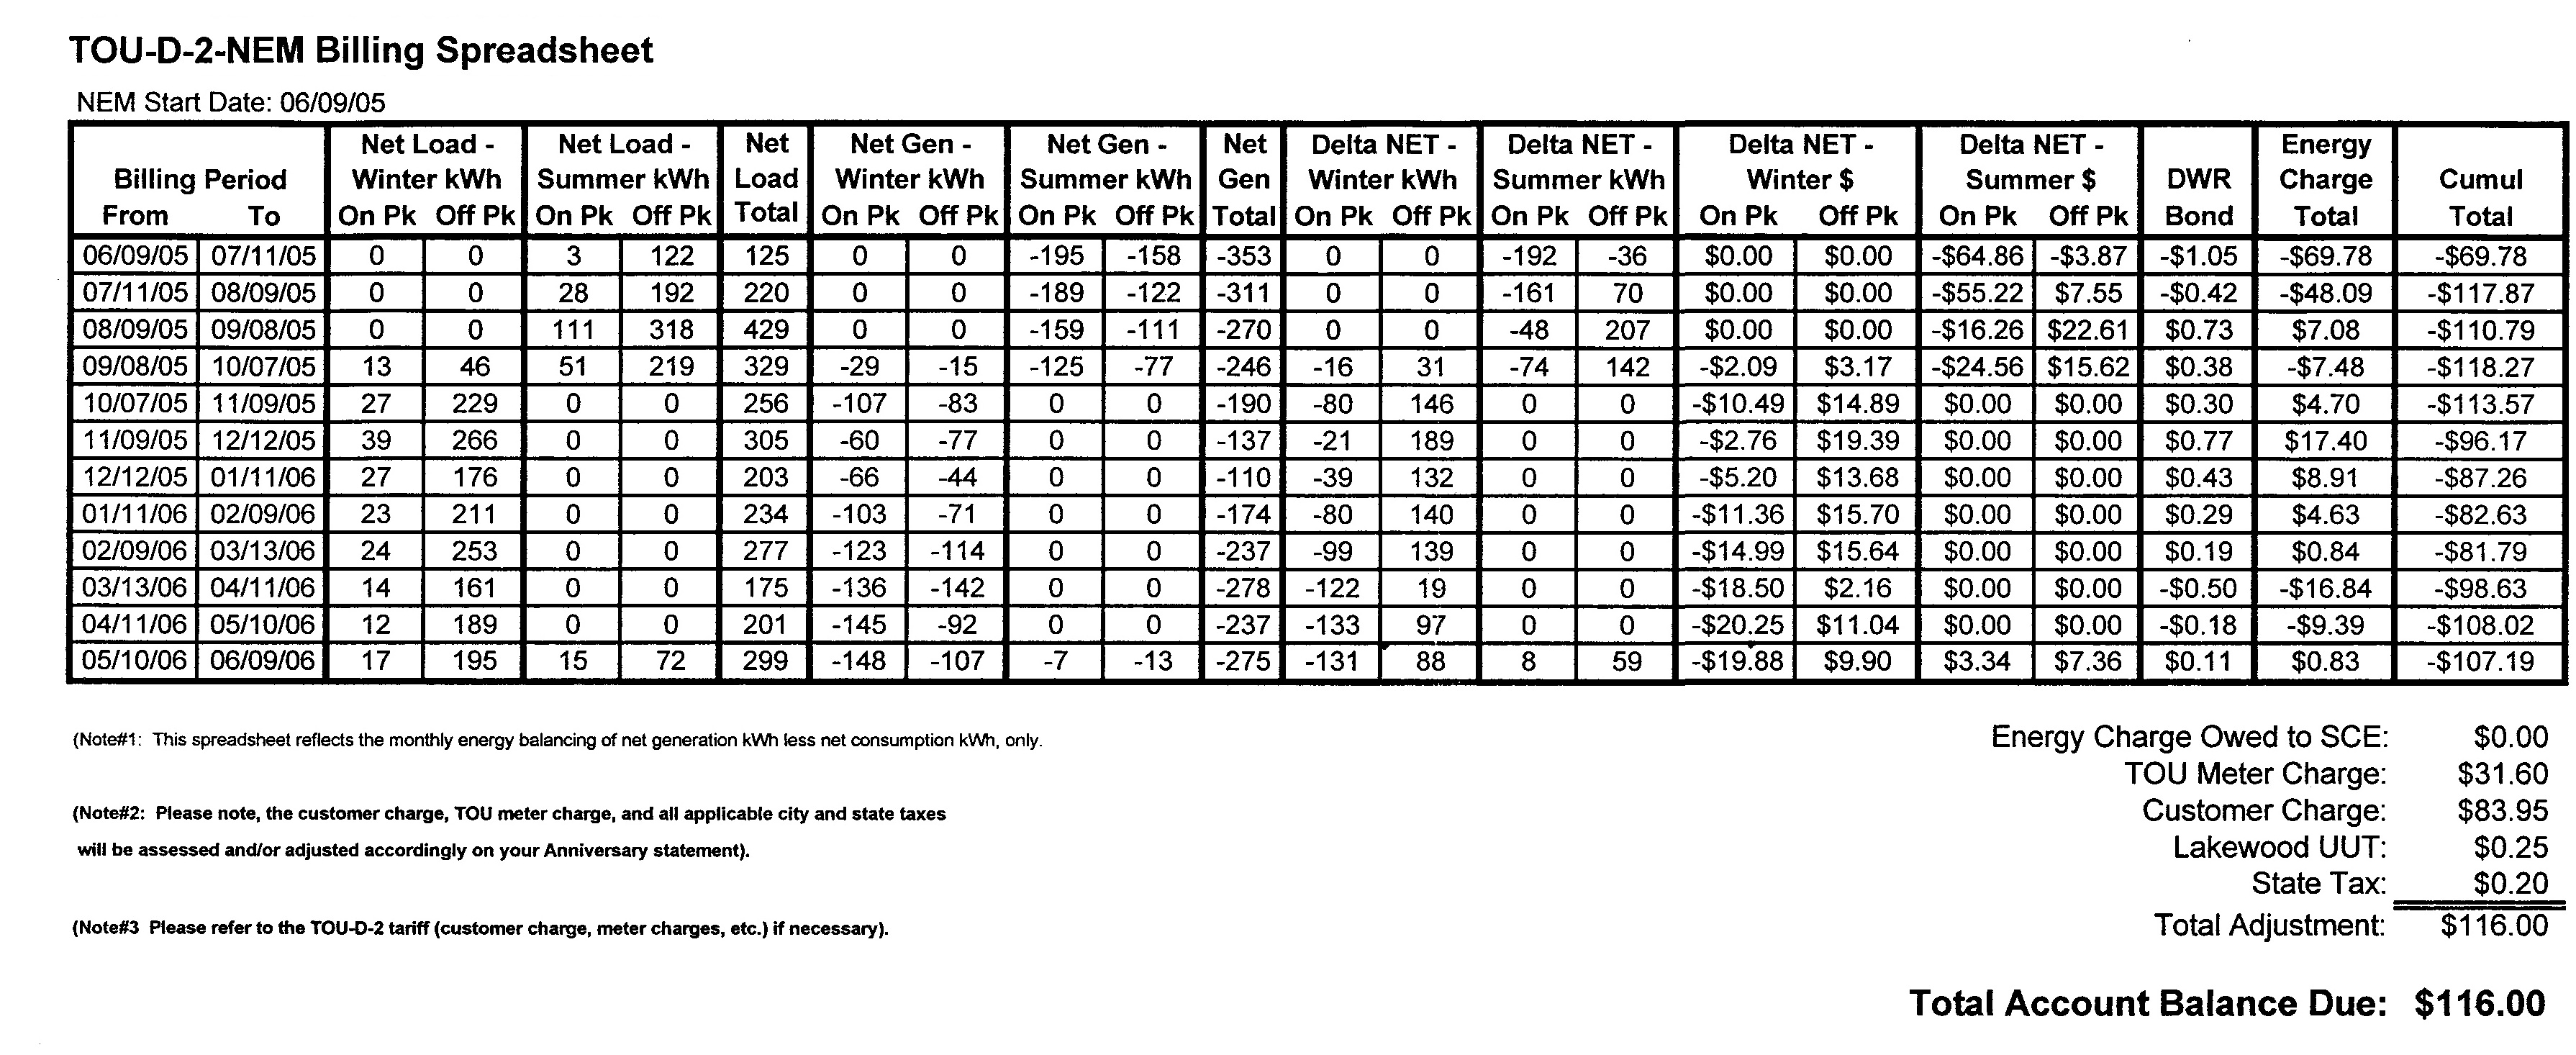
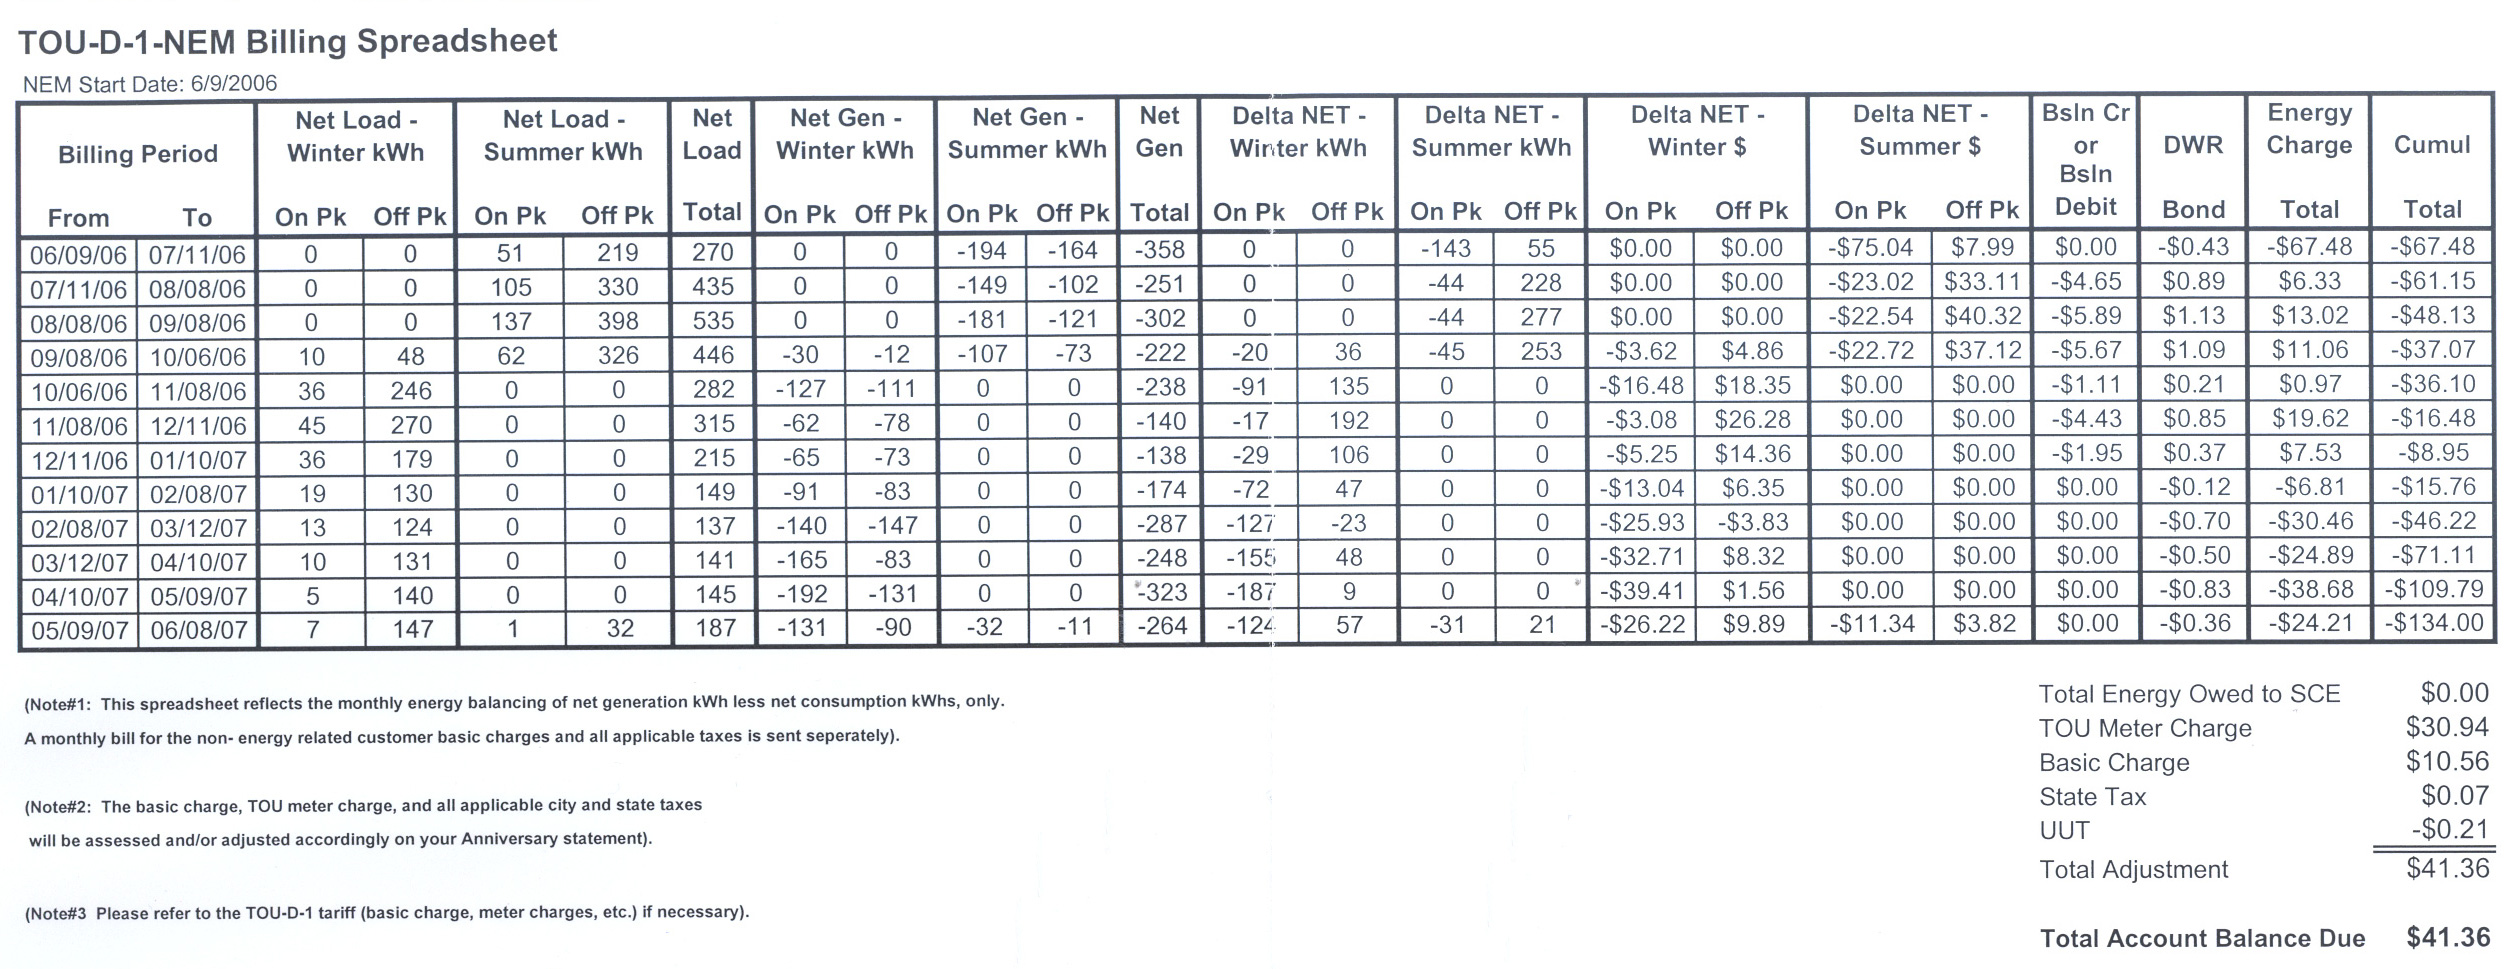
The large credit accrued has at least one misleading characteristic: it largely represents credit at the highest rate, that is, "Summer On Peak." If a rather small balance shift were to occur toward Net Load from Net Generation for this period, or possibly worse, if the Summer On Peak rate dropped significantly, a customer would risk receiving a large electricity bill. One implication of this subtlety is that an owner of a new solar electrical generation system which generates at somewhat below the level of use, might be shocked to receive a whopping electrical bill based on the inflated Summer On Peak rate ($0.335 per kilowatt hour for the TOU-D-2 schedule and $0.504 for the TOU-D-1 schedule). However, the matter of credit vs. charge cuts both ways. For the periods 2005-2006 and 2006-2007, our energy use off the grid was positive. That is, more energy was pumped in from the grid than was generated by the solar panels (2005-2006, +443 kw hours; 2006-2007, +312 kw hours), but most of this energy came to us during periods of the low billing rates and was offset by net energy generated during the high billing rate period (Summer On Peak). Had we been able to opt NOT to convert to Time Of Use billing, and had continued receiving a bill calculated at a flat rate, we would have had to pay for our net energy consumption. At $0.13 per kw hour (close to the going flat rate), our bills for those two years would have been $57.59 and $40.56, respectively). Customers at the greatest disadvantage are those who install solar panels to generate some small fraction of electricity used and then switch to Time Of Use billing. Partly for this reason, the California State Senate on May 24, 2007 and the California State Assembly on June 6, 2007 passed Assembly Bill 1714 (and approved by the Governor) which allows the owners of new photovoltaic systems during the year of 2007 to opt NOT to have Time of Use (TOU) metering to be installed. The summary of the bill reads, in part: "This bill would authorize the PUC (Public Utilities Commission) to delay implementation of time-variant pricing for ratepayers with a solar energy system, until the effective date of the rates established in the next general rate case of the state's 3 largest electrical corporations. If the commission delays implementation of time-variant pricing, the bill would require that ratepayers required to take service under time-variant pricing between January 1, 2007, and January 1, 2008, and that would otherwise qualify for flat rate pricing, be given the option to take service under flat rate or time-variant pricing."
For the current year in progress, a change in the Summer On-peak rate from $ 0.504 per kWh last year to around $0.35 per kWh this year has occurred for reasons which at this writing are not clear. That will put our domestic system at a decided disadvantage because of the excess of generated energy for the Summer On-peak periods. That is, the cumulative credit received for that period will be less than that granted last year.
All that having been said, any annual credit, whether reflecting rate disparities between summer on-peak generation and winter off-peak consumption or a surplus of generated energy throughout the year will end up making the electric company your favorite charity. "Drat and Blast!" you say. What is to be done? A customer not entirely sympathetic to the hollow-eyed plea for a spirit of giving from the executives of our public utilities needs to find alternative consumption strategies so as to bring the surplus or the credit down to zero. There are a number of amusing and intriguing possibilities which I leave to the creative genius and resourceful diligence of the reader to discover and to put into practice.
Get a check from the electric company?
Starting in January, 2011, in California, people who generate excess electricity were allowed to sell it to their electric utility. That is, for the first time in history, the tops of our roofs began to have profit potential. But before you go out and plunk down the better part of your family fortune to have solar panels installed, the fine print tells you that a customer must have both a $ credit at the end of the year and have generated more kwH than were consumed to get a check from the electric company. Moreover, since the advantages of rebates and tax credits are forsaken if an installation greatly exceeds one's need for electricity, very few customers will ever see a check at the end of the year. That's all right, I hear you say, I'll install more panels than I need and not expect to get the rebates or tax credits on the extra ones. I'll cover my roof with those extra solar panels, sell all of the excess electricity and become rich!
It turns out that the electric company practically stonewalled that idea in testimony before the California Public Utilities Commission by presenting the argument that there are many expenses connected with delivering energy to the customer; those added expenses justify that the amount paid to the customer be discounted. The operative term in California is "feed-in tariff," or the amount you'll get for feeding in your generated electricity to the grid. This writer guessed, in 2010, that the discount would result in a payment 40% of that which we are charged for electricity. Drat and blast! The members of the California Public Utilities Commission caved in to 28% of the average rate paid to the utility for consuming its electricity. My check at the end of the 2010-2011 fiscal year was $8.42, amounting to 3.7 cents per kilowatt hour, based on an average rate of 13 cents per kilowatt hour paid by customers in southern California.
An amusingly diabolical opportunity?
Still, many clouds have silver linings, and here is one to think about. Consider a computer which monitors your photovoltaic system and estimates on the basis of daily use and generation and past knowledge of annual use and generation how much extra energy you can produce each day. Then there is this guy who shows up each month with an empty black box, unhooks a full black box from the previous month, attaches the empty black box, writes you a check and leaves. He's jolly and wears a white jump suit just like the man who delivers bottled water, except that this guy brings in something empty and leaves with another one which is full. Your assignment, dear reader, is to figure out what will be in the black box to make you rich! Nice idea, huh?
The Down Side of Photovoltaic Panel Installations on Your Roof
You're the owner of your own private utility, for better or for worse. Most people won't be interested in assuming that role, just as most people aren't interested in being ham radio operators, model plane flyers or parachute jumpers. As an owner of your own private utility, it is your job to keep it operating, so you have to have a system which will give you a "heads up" when things go wrong.
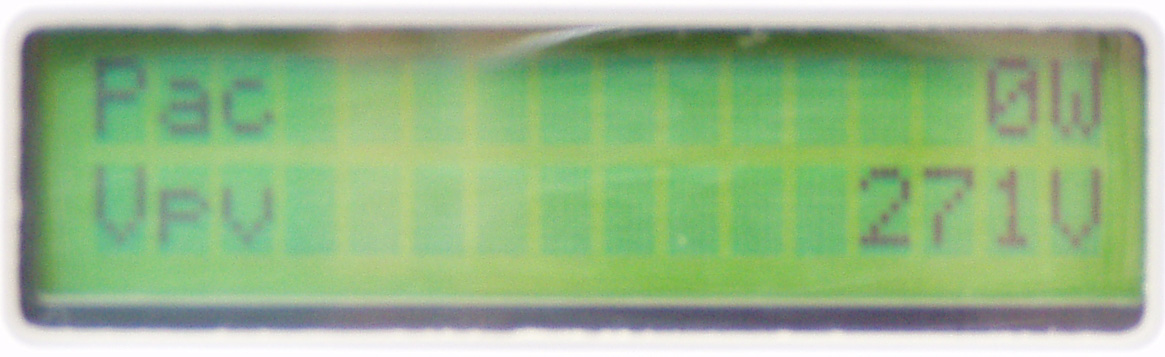
 What do you make of this, viewed in the middle of a cloudless sunny day? It is a non-
functioning inverter, that's what it is. Toward the end of
last month I climbed up to take a look at my panels and noticed a layer of dust about a month
old, so I did a routine rinse of the surface. Then, almost as an afterthought, I took a look at
the
readout of my inverter and saw what you see here. There was nothing! What did it mean? I
contacted the repairman recommended by the Sunny Boy web site and set up a visit for the
following day.
What do you make of this, viewed in the middle of a cloudless sunny day? It is a non-
functioning inverter, that's what it is. Toward the end of
last month I climbed up to take a look at my panels and noticed a layer of dust about a month
old, so I did a routine rinse of the surface. Then, almost as an afterthought, I took a look at
the
readout of my inverter and saw what you see here. There was nothing! What did it mean? I
contacted the repairman recommended by the Sunny Boy web site and set up a visit for the
following day.
 Meanwhile, I took a look in the junction box where the wires from the panels connect to the
wire
which leads to the inverter.
The removal of the inspection plate and a brief investigation revealed the damage you see
here.
The plastic shield of the twist connector had melted, leaving the conical compression
connector
which holds the wires together. The single red wire leading out of the connector to the
inverter
had melted close to its entrance in the connector. The melted break isn't visible here because
of
the angle of the photo. Much relieved, I called the repairman and told him that the problem
was
not a malfunctioning inverter, but simply a broken (melted) connection. The voltage coming
out
of my panels is around 350 V.D.C., so I chose to let the repairman do the work. He arrived
the
following day, made the repair and I was back in business. But the owner of a PV system
must
realize that a non-functioning system is money out of his (her) pocket; PV systems need to be
monitored and maintained. This kind of problem cries out, at the very least, for a visible
indicator in one's house when things are operating properly and perhaps a readout showing
the
kwH generated throughout a day. Why did it happen? The jury is still out, but an inspection
of
the interior of the inverter revealed about a dozen dead grass hoppers. Perhaps an insect in
the
junction box was electrocuted. Perhaps oxidation over five years of operation began to
produce
an excessive amount of heat in the connection which finally caused the breakage. Stay
tuned.
Meanwhile, I took a look in the junction box where the wires from the panels connect to the
wire
which leads to the inverter.
The removal of the inspection plate and a brief investigation revealed the damage you see
here.
The plastic shield of the twist connector had melted, leaving the conical compression
connector
which holds the wires together. The single red wire leading out of the connector to the
inverter
had melted close to its entrance in the connector. The melted break isn't visible here because
of
the angle of the photo. Much relieved, I called the repairman and told him that the problem
was
not a malfunctioning inverter, but simply a broken (melted) connection. The voltage coming
out
of my panels is around 350 V.D.C., so I chose to let the repairman do the work. He arrived
the
following day, made the repair and I was back in business. But the owner of a PV system
must
realize that a non-functioning system is money out of his (her) pocket; PV systems need to be
monitored and maintained. This kind of problem cries out, at the very least, for a visible
indicator in one's house when things are operating properly and perhaps a readout showing
the
kwH generated throughout a day. Why did it happen? The jury is still out, but an inspection
of
the interior of the inverter revealed about a dozen dead grass hoppers. Perhaps an insect in
the
junction box was electrocuted. Perhaps oxidation over five years of operation began to
produce
an excessive amount of heat in the connection which finally caused the breakage. Stay
tuned.Solar Silliness
When we installed the panels on our house roof I had the expectation that we could allow them to sit there without a worry or care and to generate electricity during daylight hours for the next twenty-five years when the guarantee runs out. That they ought to be exposed to unshaded sunlight was obvious, but my early discovery that in order to achieve maximum output they need also to be rinsed periodically was an early lesson in the maintenance of solar panels. I have been more recently surprised that these two points are not fully appreciated by everyone, not even some "experts."
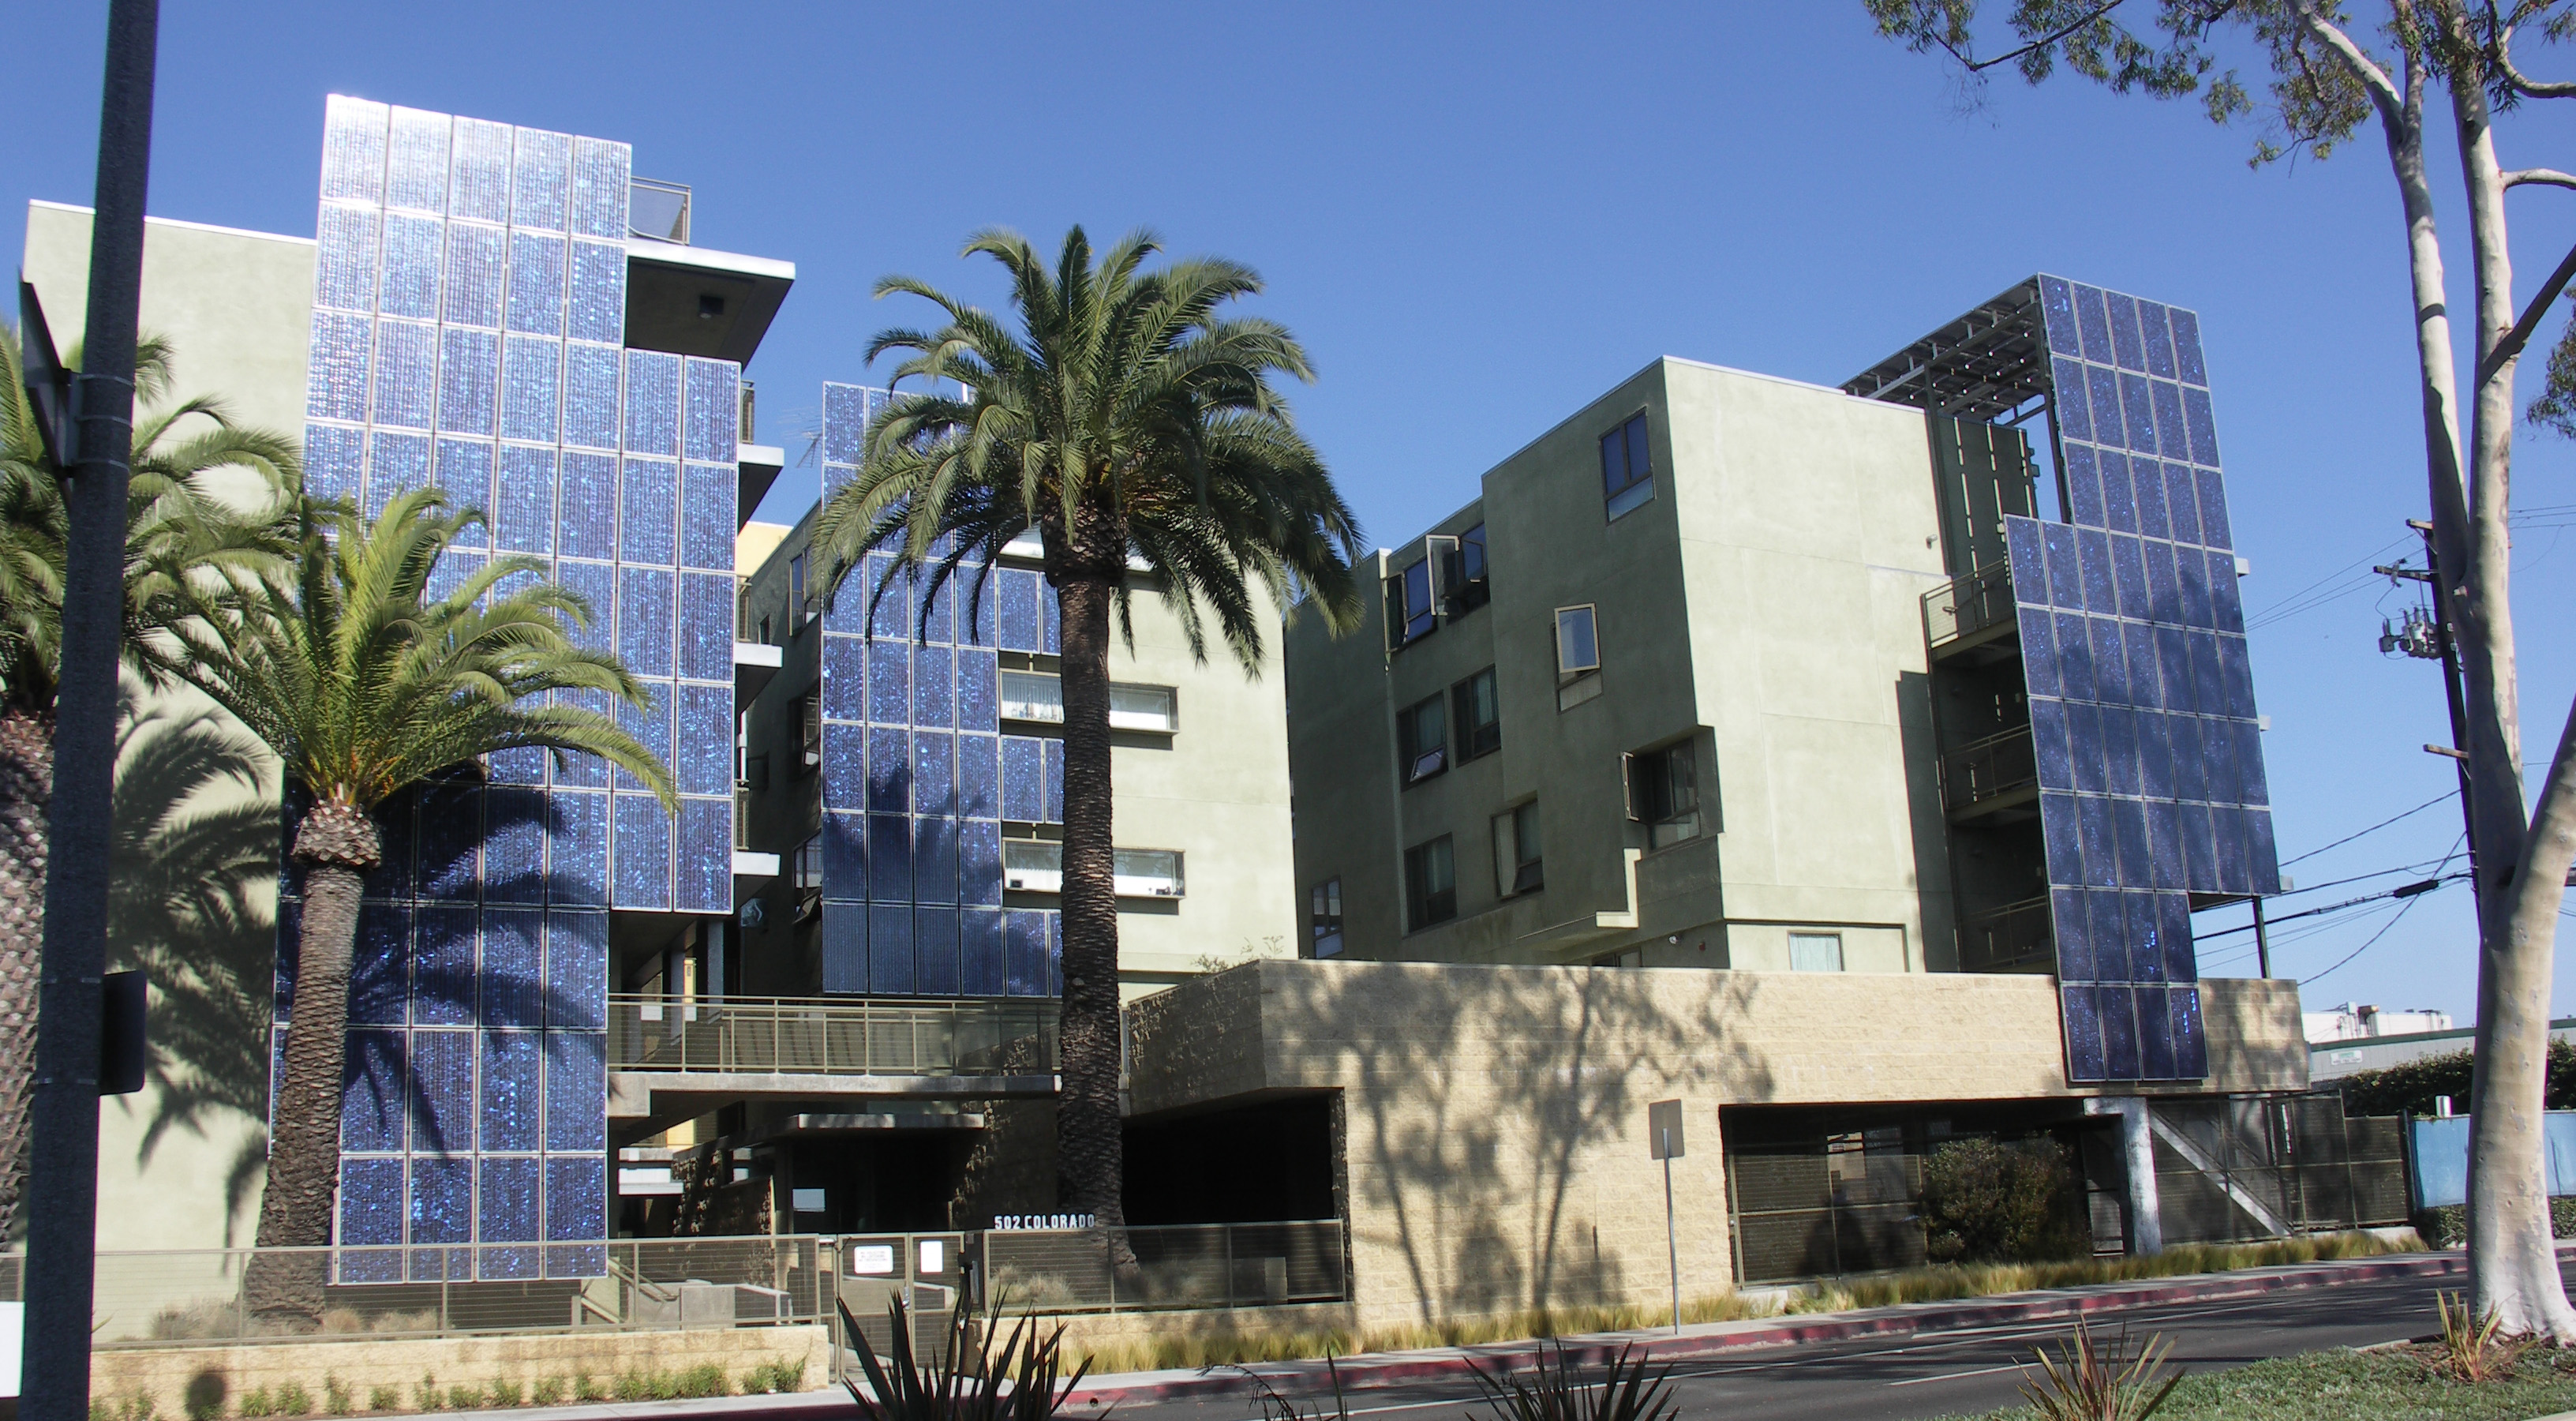
 As more people install PV systems it stands to reason that some will make informed choices
and
others will not. It is with more than a little amusement then that one can find some rather
large
but ill-conceived installations carried out by people one would think should know better.
Here is
an ambitious private installation of approximately 35 kW on an apartment house in Santa
Monica,
California,
consisting of both vertically and horizontally mounted panels. The vertical panels face
southwest
and do not receive direct sunlight until late each morning. Moreover, neither the vertical
panels
nor the horizontal panels at the right are tilted toward the south at the angle of latitude. The
shadows cast by the 3 palm trees and the eucalyptus tree (right) for the better part of
the day almost certainly will have an attenuating effect on the energy output; how much
would be
a function of the internal series/parallel circuitry but could be determined with a simulated
equivalent unshaded system.
There does seem to be a cleaning schedule in place judging from the blue crystalline
appearance
of the panels' surfaces, at left.
As more people install PV systems it stands to reason that some will make informed choices
and
others will not. It is with more than a little amusement then that one can find some rather
large
but ill-conceived installations carried out by people one would think should know better.
Here is
an ambitious private installation of approximately 35 kW on an apartment house in Santa
Monica,
California,
consisting of both vertically and horizontally mounted panels. The vertical panels face
southwest
and do not receive direct sunlight until late each morning. Moreover, neither the vertical
panels
nor the horizontal panels at the right are tilted toward the south at the angle of latitude. The
shadows cast by the 3 palm trees and the eucalyptus tree (right) for the better part of
the day almost certainly will have an attenuating effect on the energy output; how much
would be
a function of the internal series/parallel circuitry but could be determined with a simulated
equivalent unshaded system.
There does seem to be a cleaning schedule in place judging from the blue crystalline
appearance
of the panels' surfaces, at left.
 The shading of one's solar panels by a neighbor's trees can rise to a litigious level if one lives
in
California. The Solar Shade Control Act, signed by the governor in 1978, bans trees or
shrubs
from shading more than 10 percent of a neighbor's solar panels between 10 a.m. and 2 p.m.
and
includes shading on panels installed after the trees were planted if the trees grow to such a
height
to produce shade which exceeds that which is allowed by the law. A recent celebrated case
invoking that law involves neighbors in a community near San Francisco. Neighbor A
planted
eight redwood trees, B, between 1997 and 1999. Neighbor C installed a 10 kW photovoltaic
solar panel system, C, in 2001. Redwood trees, B, grew until their shade, D, exceeded that
which is allowed by the Solar Shade Control Act. In December 2007, Santa Clara County
Superior Court Judge Kurt Kumli ruled that six of the trees can remain and that the two
generating the most shade must be removed. It was reported on July 23, 2008 by KGO-TV
that
Governor Schwarzenegger has settled the conflict by signing a bill which states that a tree
which
casts a shadow onto a neighbor's solar panel will no longer have to be cut down, as long as
the
trees were planted before the panels were installed.
The shading of one's solar panels by a neighbor's trees can rise to a litigious level if one lives
in
California. The Solar Shade Control Act, signed by the governor in 1978, bans trees or
shrubs
from shading more than 10 percent of a neighbor's solar panels between 10 a.m. and 2 p.m.
and
includes shading on panels installed after the trees were planted if the trees grow to such a
height
to produce shade which exceeds that which is allowed by the law. A recent celebrated case
invoking that law involves neighbors in a community near San Francisco. Neighbor A
planted
eight redwood trees, B, between 1997 and 1999. Neighbor C installed a 10 kW photovoltaic
solar panel system, C, in 2001. Redwood trees, B, grew until their shade, D, exceeded that
which is allowed by the Solar Shade Control Act. In December 2007, Santa Clara County
Superior Court Judge Kurt Kumli ruled that six of the trees can remain and that the two
generating the most shade must be removed. It was reported on July 23, 2008 by KGO-TV
that
Governor Schwarzenegger has settled the conflict by signing a bill which states that a tree
which
casts a shadow onto a neighbor's solar panel will no longer have to be cut down, as long as
the
trees were planted before the panels were installed.
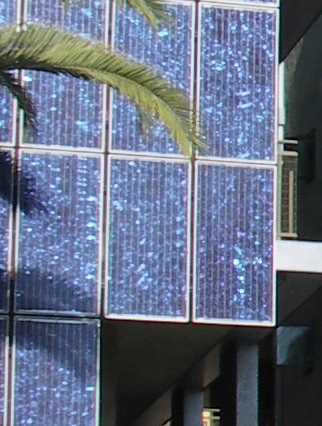
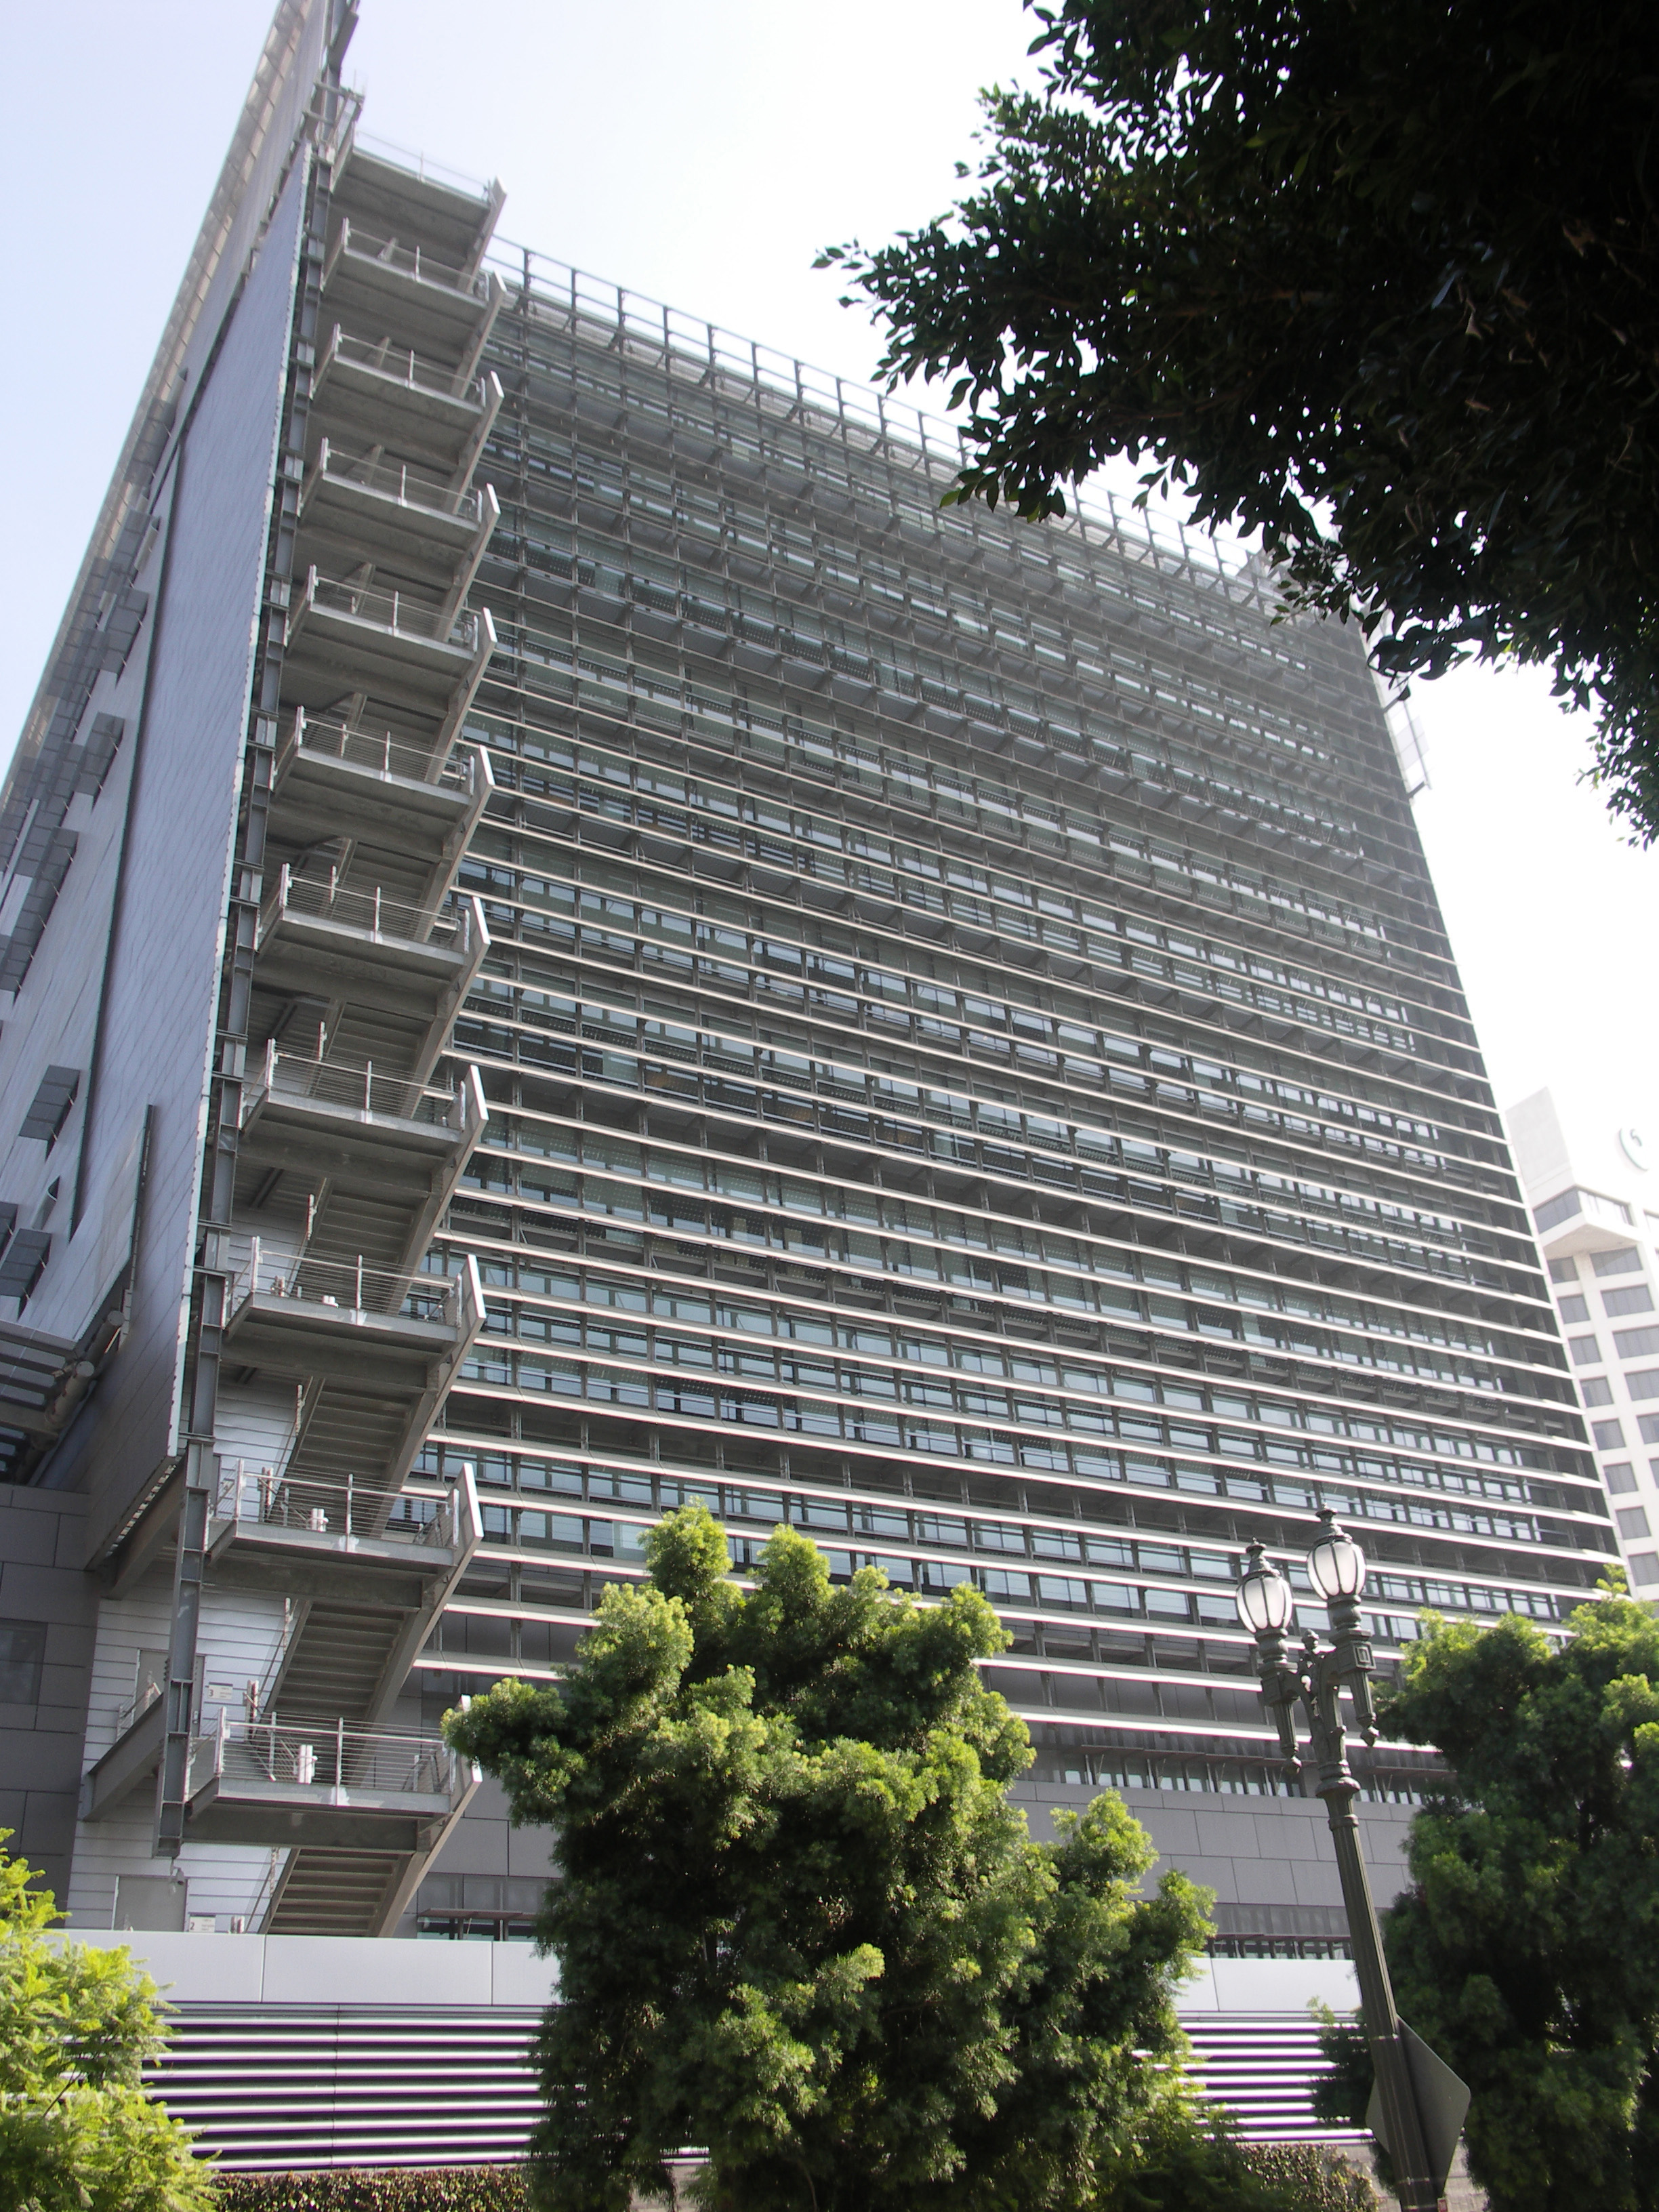 The California Department of Transportation building in Los Angeles (right) has a system of
panels sandwiched in a casing of bullet-proof glass on the south face, but notice in the
close-up
The California Department of Transportation building in Los Angeles (right) has a system of
panels sandwiched in a casing of bullet-proof glass on the south face, but notice in the
close-up
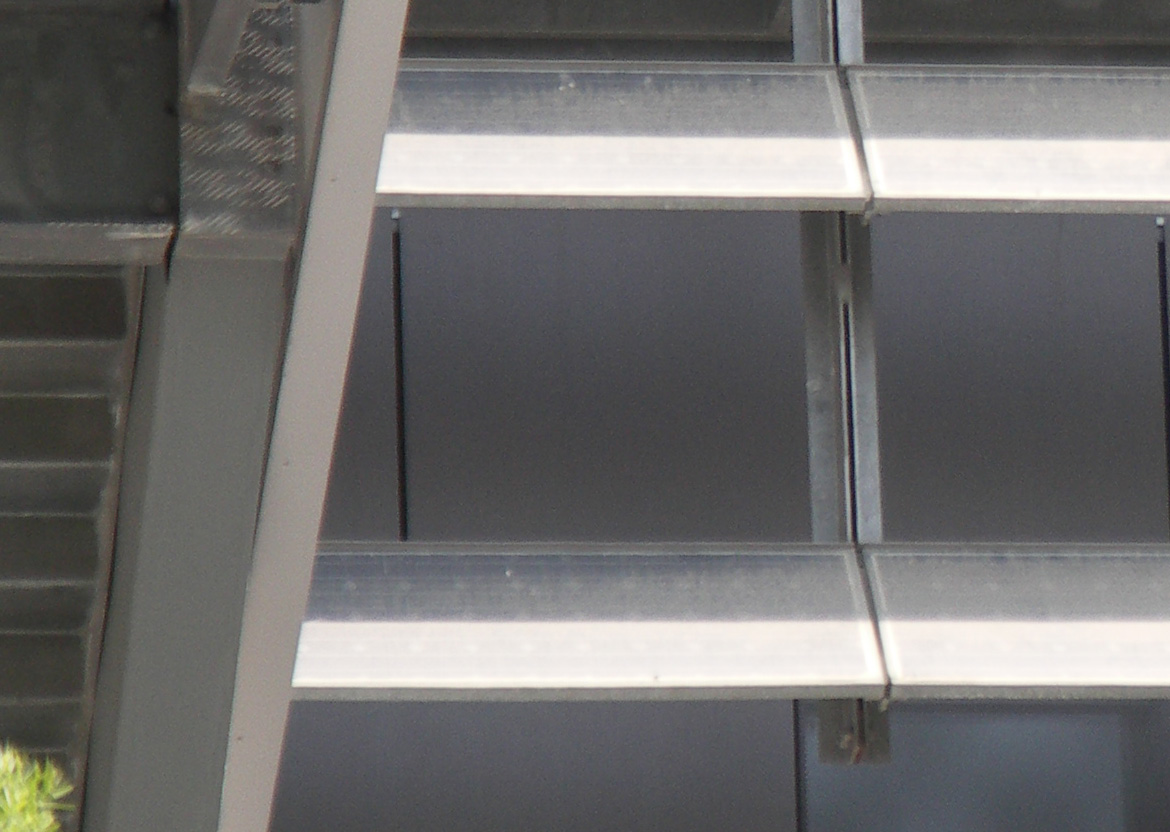 that each rank of panels shadows the one below. Moreover, there is no cleaning schedule for
the
glass surface. If one could depend on frequent inundations blowing from the south then these
panels would be periodically cleaned, but that kind of weather doesn't happen in southern
California. We have lengthy periods without rain and when the storms do come they're more
often in the form of vertical drizzles which will very definitely clean the uppermost rank of
panels
but do little good for the ones below.
that each rank of panels shadows the one below. Moreover, there is no cleaning schedule for
the
glass surface. If one could depend on frequent inundations blowing from the south then these
panels would be periodically cleaned, but that kind of weather doesn't happen in southern
California. We have lengthy periods without rain and when the storms do come they're more
often in the form of vertical drizzles which will very definitely clean the uppermost rank of
panels
but do little good for the ones below.
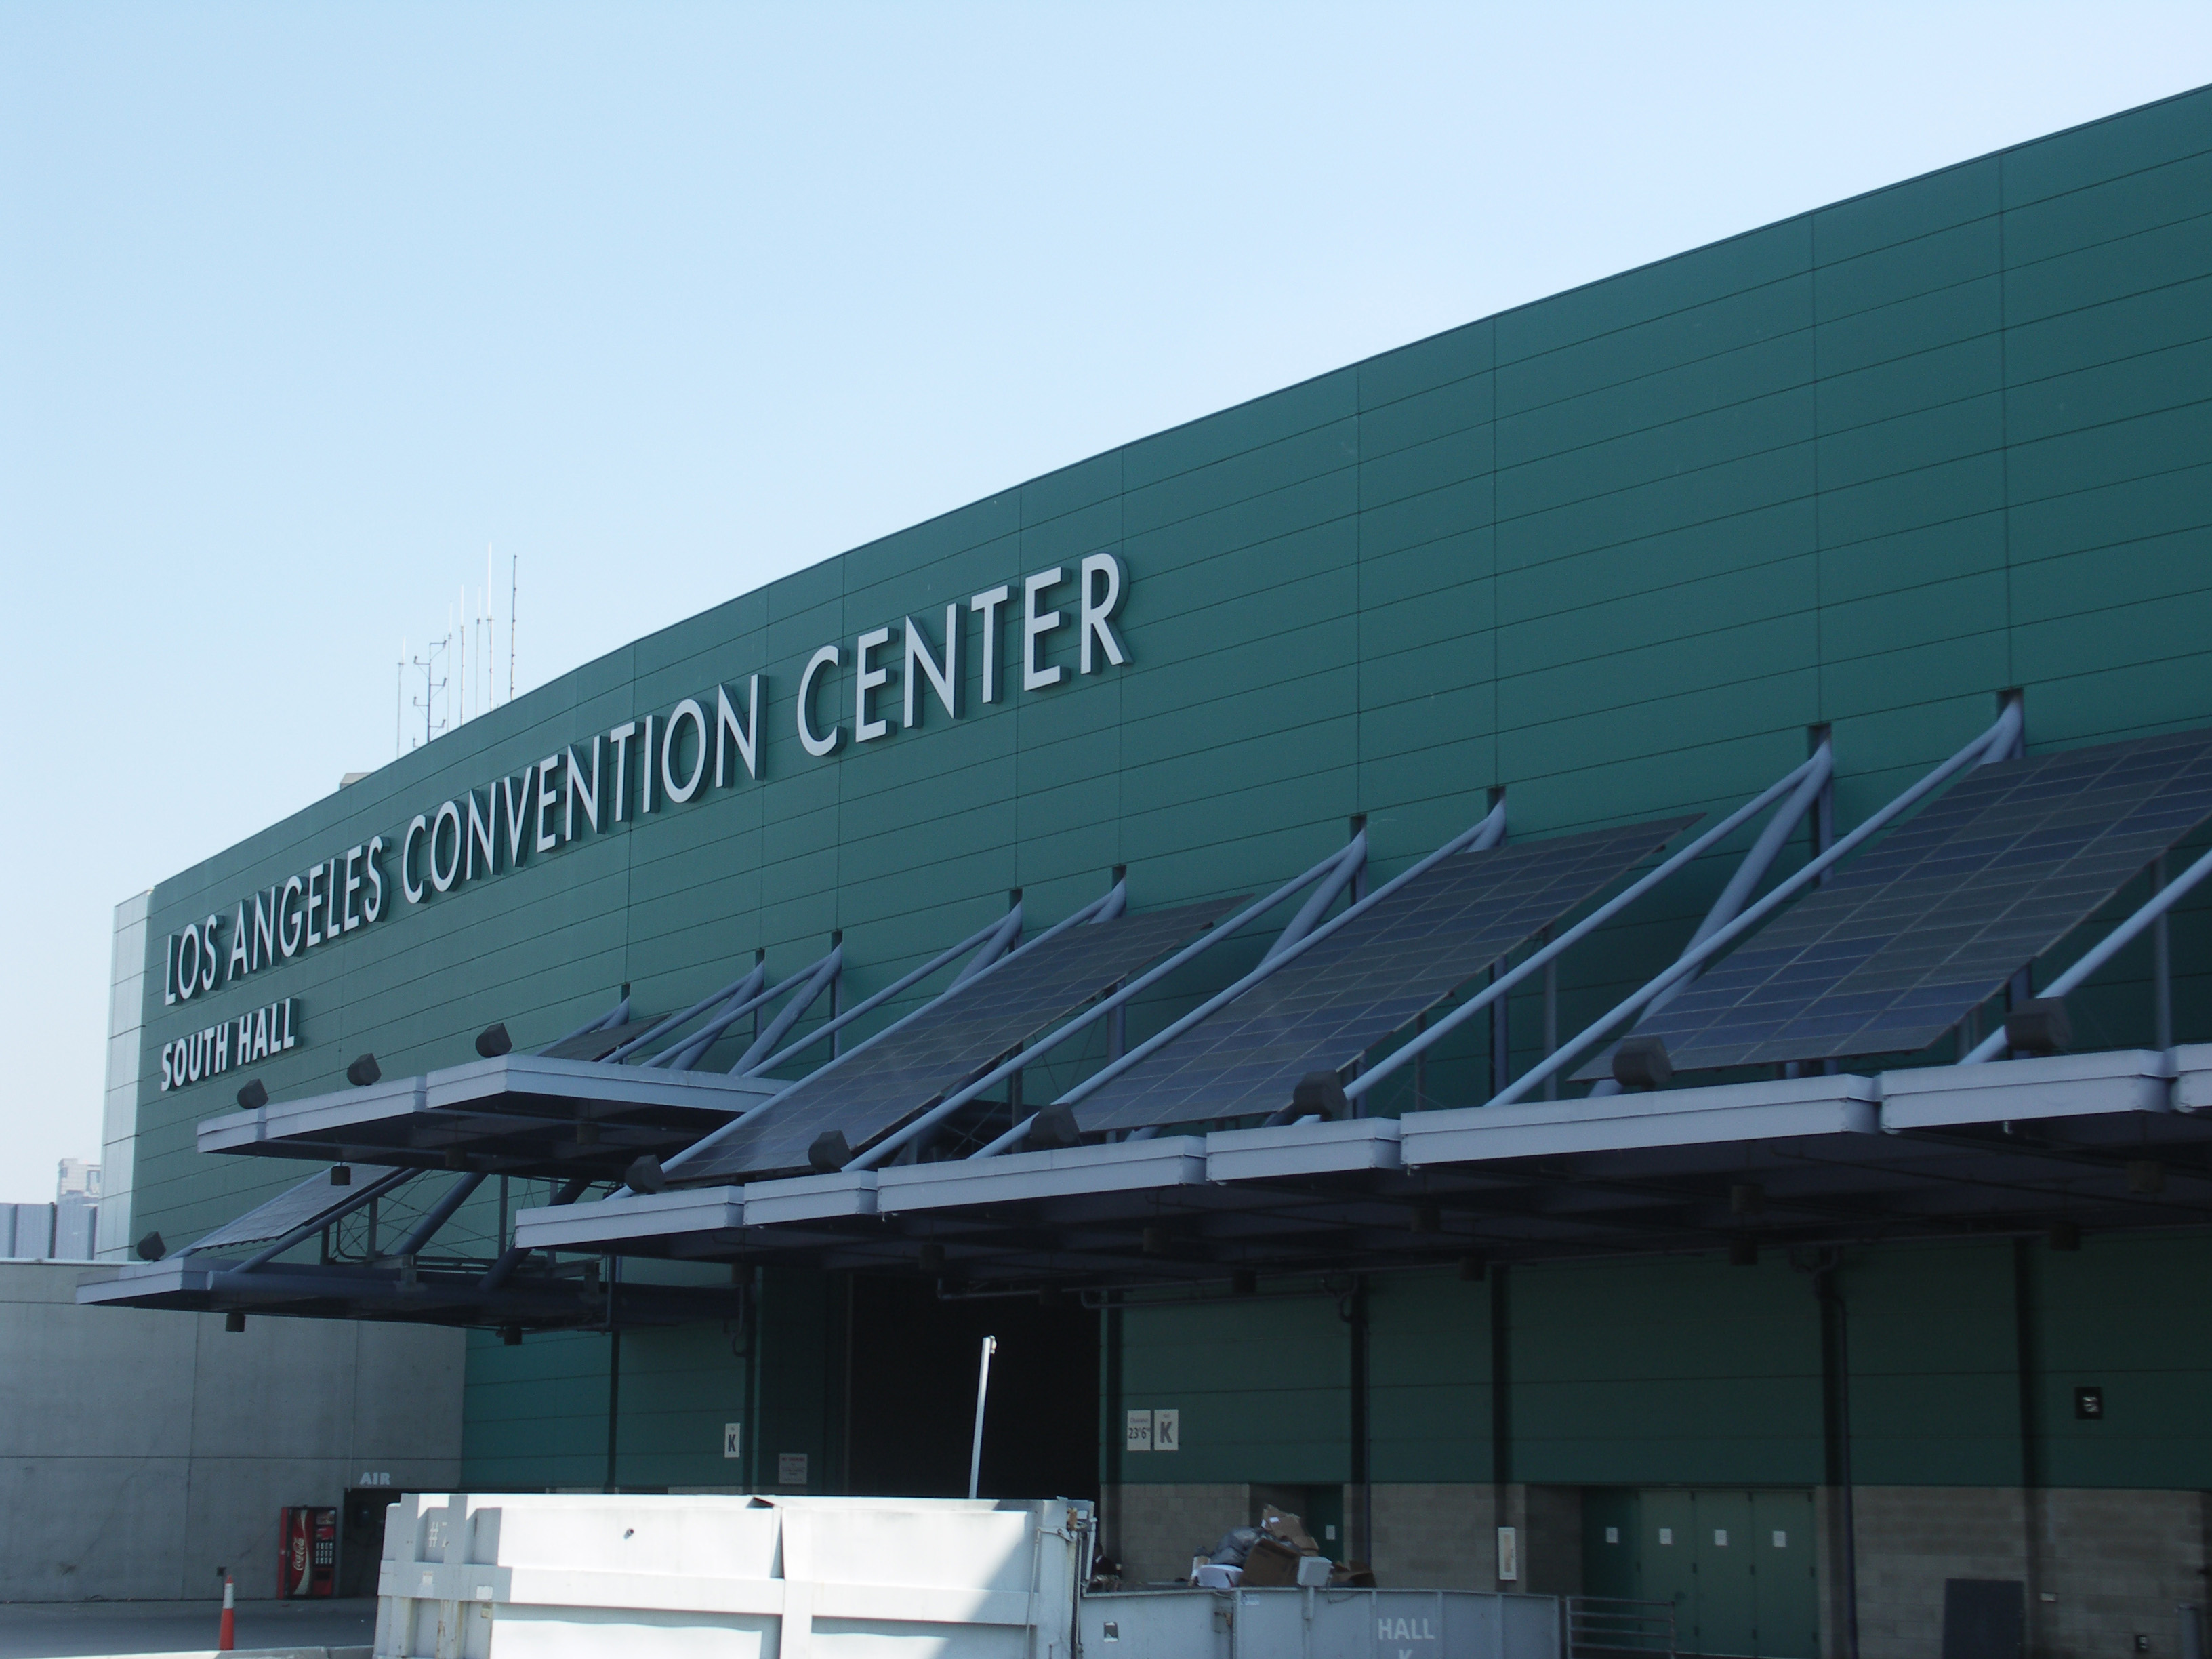 The Los Angeles Convention Center has a system which was installed by the L.A.
Department of
Water and Power. The panels were placed around the periphery of the building well below
the
roof
line (I would estimate 4-7 meters). The panels which are mounted on the east and west sides
receive no direct sunlight for about
half of each day. The ones mounted on the west side and shown in the photograph at the right
are
in the shade until early afternoon.
The Los Angeles Convention Center has a system which was installed by the L.A.
Department of
Water and Power. The panels were placed around the periphery of the building well below
the
roof
line (I would estimate 4-7 meters). The panels which are mounted on the east and west sides
receive no direct sunlight for about
half of each day. The ones mounted on the west side and shown in the photograph at the right
are
in the shade until early afternoon.
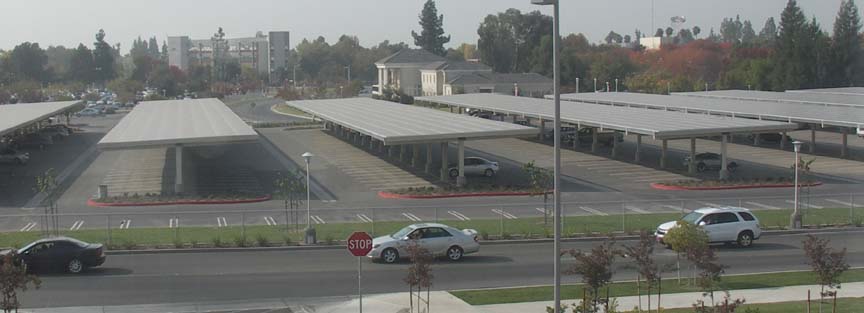 A system consisting of 3872 300 watt panels (Schott ASE-300-DGF/50) yielding a rated
power
output of 1162 kilowatts was recently installed on the
campus of CSU Fresno over Parking Lot V. The general contractor for this installation was
Chevron Energy Solutions. The owner of the panels is MMA Renewable Ventures with
which
the campus has entered into a 20-year power purchase agreement at a starting rate of $0.16
per
kilowatt hour and a 2% annual inflation adjustment. An examination of current rates paid by
big
users of electricity makes a rate of $0.16 per kilowatt hour appear to be a bit pricey. Note that
there seems to be
a slight tilt toward the south of 1-2 degrees, possibly with drainage in mind.
A system consisting of 3872 300 watt panels (Schott ASE-300-DGF/50) yielding a rated
power
output of 1162 kilowatts was recently installed on the
campus of CSU Fresno over Parking Lot V. The general contractor for this installation was
Chevron Energy Solutions. The owner of the panels is MMA Renewable Ventures with
which
the campus has entered into a 20-year power purchase agreement at a starting rate of $0.16
per
kilowatt hour and a 2% annual inflation adjustment. An examination of current rates paid by
big
users of electricity makes a rate of $0.16 per kilowatt hour appear to be a bit pricey. Note that
there seems to be
a slight tilt toward the south of 1-2 degrees, possibly with drainage in mind.
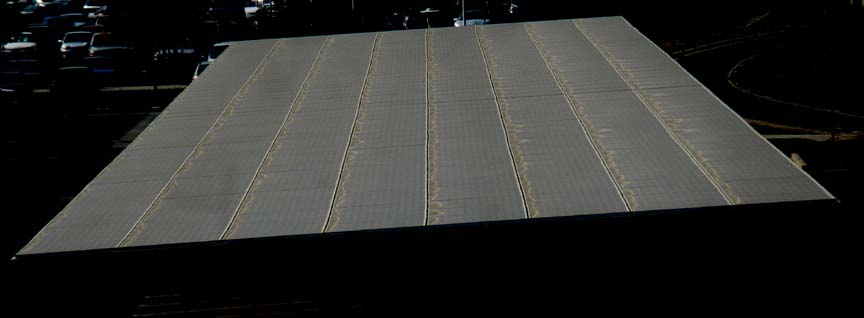 However, in the image at the right which has had its brightness reduced and contrast
increased, the effect of such drainage where morning dew and occasional drizzles are the only
sources of precipitation for
several months running is
a distinct residue which builds up over the cells at the lowest elevation of each set of panel
segments. It is not clear at this writing if there is a program of routine rinsing in place.
However, in the image at the right which has had its brightness reduced and contrast
increased, the effect of such drainage where morning dew and occasional drizzles are the only
sources of precipitation for
several months running is
a distinct residue which builds up over the cells at the lowest elevation of each set of panel
segments. It is not clear at this writing if there is a program of routine rinsing in place.
 Here's one worth mentioning. This 205 kilowatt array is in Washington, D.C. and is said to
comprise 891 230 W solar panels. Sure enough, 891 x 230 / 1000 = 204.93 kilowatts. But
Washington, D.C. is at latitude 38 o 53' north which means that at the very
best,
the rated power output of horizontal panels will be attenuated by an average factor of
Here's one worth mentioning. This 205 kilowatt array is in Washington, D.C. and is said to
comprise 891 230 W solar panels. Sure enough, 891 x 230 / 1000 = 204.93 kilowatts. But
Washington, D.C. is at latitude 38 o 53' north which means that at the very
best,
the rated power output of horizontal panels will be attenuated by an average factor of cosine(38 o 53') = 0.78 , decreasing the figure above to 159.6 kilowatts. Judging from the image at the right, it would appear that there isn't the slightest indication of tilt so as to allow the panels to self-clean in the annual rainfall of 39.3 inches. (100 cm). The average solar energy in Washington, D.C. is about 73% that of southern California, so it could be argued that horizontal panels will gain a little from the diffuse sunlight through the frequent cloud cover over Washington, D.C., but most likely the gain will be more than offset by the loss due to the lack of tilt on sunny days. Moreover, one would expect the dustfall on these panels to turn to mud on the surface, not unlike some of the other examples in this section, until the panel guys arrive to give them a power rinse. Where is this ill-conceived installation, I hear you ask? It is on the roof of the headquarters of the . . . wait for it . . . U.S. Department of Energy.
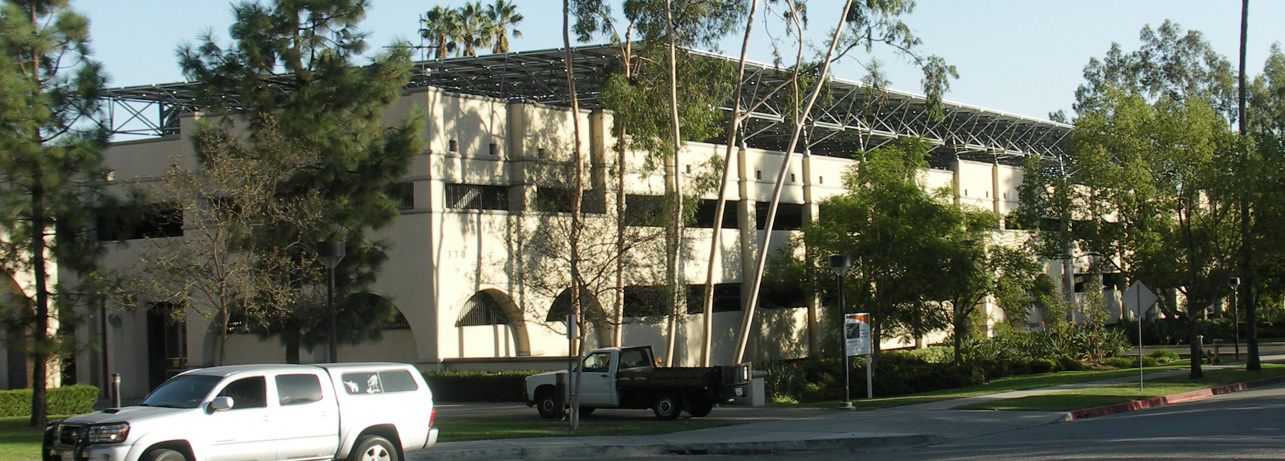 This installation may be found above the top level of a parking structure on Holliston Avenue
at
Caltech in Pasadena, California. It consists of 1404 170 watt Suntech STP170S-24/Ab-1
panels,
giving a
total rated power output of 238.68 kilowatts. The sign in the photo at the driveway claims
199
kilowatts. It was installed by EI Solutions. Note that the
panels are mounted horizontally. What is not clear from the image is that the only practical
access
to the panels for periodic rinsing would have to be by hydraulic lift on the east and west sides.
The installation runs nearly the length of the structure and the limited access to the panel
surface
at the north and south ends would make periodic rinsing of the entire panel surface
impractical
from those access points. A representative of Suntech Energy Solutions points out that
where
the realization of installations such as this, including the execution of "power purchase
agreements" by investor groups, are concerned, optimizing energy output is only one of a
variety
of considerations. The others are the level and conditions of any production rebate,
time-of-use
energy tariffs by the electrical utility, financing requirements for the area available and the
stated
objectives of the client. That is, given the sometimes conflicting agendas encountered when
putting together an investor group to realize an installation such as this, other exigencies have
to
be considered.
This installation may be found above the top level of a parking structure on Holliston Avenue
at
Caltech in Pasadena, California. It consists of 1404 170 watt Suntech STP170S-24/Ab-1
panels,
giving a
total rated power output of 238.68 kilowatts. The sign in the photo at the driveway claims
199
kilowatts. It was installed by EI Solutions. Note that the
panels are mounted horizontally. What is not clear from the image is that the only practical
access
to the panels for periodic rinsing would have to be by hydraulic lift on the east and west sides.
The installation runs nearly the length of the structure and the limited access to the panel
surface
at the north and south ends would make periodic rinsing of the entire panel surface
impractical
from those access points. A representative of Suntech Energy Solutions points out that
where
the realization of installations such as this, including the execution of "power purchase
agreements" by investor groups, are concerned, optimizing energy output is only one of a
variety
of considerations. The others are the level and conditions of any production rebate,
time-of-use
energy tariffs by the electrical utility, financing requirements for the area available and the
stated
objectives of the client. That is, given the sometimes conflicting agendas encountered when
putting together an investor group to realize an installation such as this, other exigencies have
to
be considered.
 A Case Study
A large system (557 kW) was recently installed on the campus of CSU Dominguez Hills by Sun Edison. There are 3279 panels, each rated at 170 watts, bringing the maximum rated power output to 557,430 watts or 557.43 kilowatts. The panels have been mounted nearly horizontally over Parking Lot 1. At our latitude of 34 degrees north they ought to have been tilted toward the south by 34 degrees if the objective is to maximize the generation of energy. At noon at our latitude on the summer solstice the sun is 10.5 degrees from the vertical. At noon on the winter solstice it is 57.5 degrees from the vertical. Assuming 0% loss if the panels are pointing directly at the sun, horizontal panels suffer a power loss of 1.7% and 46.3% at noon on the summer and winter solstices, respectively, for an average annual loss of 24%. On the other hand, under Time of Use (TOU) billing (discussed above), the On-peak period is from 10am to 6pm when the rate charged is higher and if the objective is to maximize one's $ credit the panels ought to be tilted appropriately in a southwesterly direction. Even though we often get brilliant sunlight in southern California from 7am to 10am, that time period still falls in the category of Off-peak.
 But it gets worse than that. The lack of tilt means that there is no natural
gravity runoff for rain or rinse water. If it appears to you that from the acute angle of view in
the
photo above the surface color is
something other than the typical metallic blue of a silicon photovoltaic cell, you would be
right.
It
appears (at this writing in the fall of 2006) that there has been no rinsing service to maintain
maximum output.
The surface has been allowed to collect the dustfall of greater Los Angeles since installation
around
four months ago during which time there has been no rainfall. It is
not clear at this writing what the dark spots in the middle of several of the panels represent,
but
the buildup of dirt certainly doesn't bode well for the overall output of the panel array. It is
also
not clear at this writing who suffers the greatest disadvantage (the university or the power
company) if the power output drops
significantly due to lack of maintenance. Only knowledge of the specific billing arrangement
worked out in the contract would reveal that information.
But it gets worse than that. The lack of tilt means that there is no natural
gravity runoff for rain or rinse water. If it appears to you that from the acute angle of view in
the
photo above the surface color is
something other than the typical metallic blue of a silicon photovoltaic cell, you would be
right.
It
appears (at this writing in the fall of 2006) that there has been no rinsing service to maintain
maximum output.
The surface has been allowed to collect the dustfall of greater Los Angeles since installation
around
four months ago during which time there has been no rainfall. It is
not clear at this writing what the dark spots in the middle of several of the panels represent,
but
the buildup of dirt certainly doesn't bode well for the overall output of the panel array. It is
also
not clear at this writing who suffers the greatest disadvantage (the university or the power
company) if the power output drops
significantly due to lack of maintenance. Only knowledge of the specific billing arrangement
worked out in the contract would reveal that information. Do real data support the depressing conclusion expressed above? Well, yes, generally. On February 28, 2007, a cloudless day from 10am to early afternoon, the system on our rooftop peaked at 10:51 am with an average power output of 2271 watts over the 15 minute interval (7 minutes on either side) which bracketed the maximum of 2284 watts. Taking the theoretical maximum power output specification of these panels, the 2271 watt average translates to [2271/(18 x 165)]x100 = 76.5%. On that same day the power of the university system peaked at 12:15 pm, showing a power output of 319,841 watts. Carrying out an equivalent calculation one gets [318,841/(3279 x 170)] x 100 = 57.4%, a value diminished, I would offer, by the lack of tilt of the panels at the angle of our latitude. We are stymied at this point from looking more closely at these figures and trying to establish how much the diminished value is caused by the lack of tilt and how much by dustfall because the tilt of the domestic roof-top system is itself not ideal. One would need to observe the output of at least one 170 watt panel the normal vector of which is pointing directly at the sun at the time of maximum power by the array of 3279 panels to establish a credible attenuation of power owing both to tilt as well as dustfall.
Here is the one-year line chart of energy generated vs. date for the university system.
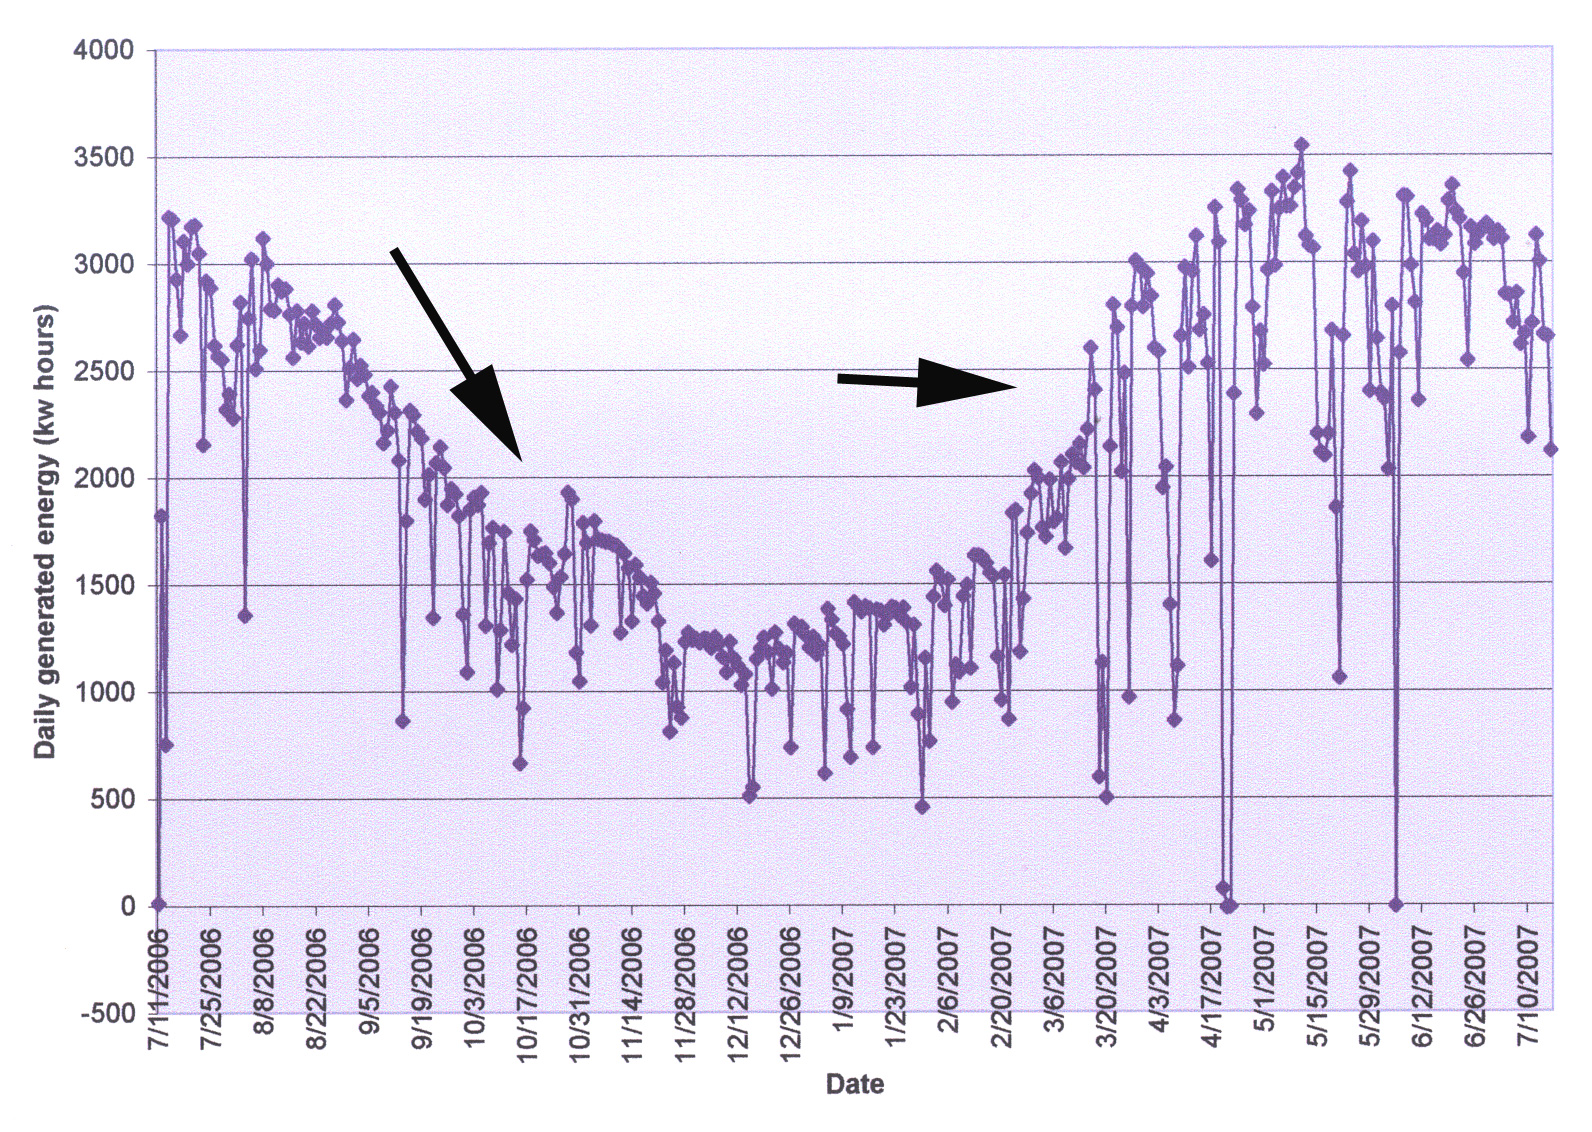
Note the two discontinuities identified by the arrows. They represent the increased output following rinsing. That we are experiencing the driest year since records have been kept starting in the latter part of the nineteenth century, we've had many cloudless days. All maxima on the chart above are representative of energy output on cloudless days. Taking the highest adjacent maxima before and after cleaning, we have 10/27/2006 and 10/28/2006, 1644 kwh and 1930 kwh. The lower value is 85.2% of the upper value. Again on 3/15/2007 and 3/16/2007 we have 2222 kwh and 2599 kwh respectively. The low value is 85.5% of the higher value, suggesting that the event which triggers rinsing by the maintenance crew is a 15% drop from maximum expected value. The very low energy outputs and those at zero are unexplained. They are either outages of the panel system for part or all of the day or there was a failure of the data collection system. No explanation is available at this writing.
Photovoltaic Panels, a Game Changer?
In urban southern California it isn't unusual to see oil derricks pumping petroleum near private residences like the one shown here.
 The owners of the pumped oil almost certainly are NOT the residents of any of the
surrounding houses because the mineral rights of the neighborhood were bought decades ago.
But how about a rooftop solar installation which produces energy whether you are at home, at
work or on a holiday. It keeps pumping energy, just like the oil derrick but there is no
drilling, no spills, no damage to the environment and no purchase of mineral rights are
necessary. Give it some thought.
The owners of the pumped oil almost certainly are NOT the residents of any of the
surrounding houses because the mineral rights of the neighborhood were bought decades ago.
But how about a rooftop solar installation which produces energy whether you are at home, at
work or on a holiday. It keeps pumping energy, just like the oil derrick but there is no
drilling, no spills, no damage to the environment and no purchase of mineral rights are
necessary. Give it some thought. Conclusion
So as to gain maximum advantage from an installed system of photovoltaic panels, the following preliminary conclusions can be made. Most unfortunately, if you are not a resident of the State of California, only (2), (3) and possibly (1) make any sense. Read on:
1. If you are connected to a grid, install a system sufficiently large to generate as much energy as you consume during summer and winter periods, because if your rate varies by time of day and by season, and you take advantage of generating more energy than you consume during summer daylight hours, when the rate is the highest, and consume more than you generate during long winter nights when the rate is lower, there is no guarantee that such a rate schedule will remain to your advantage over the long term. In any case, you need to start thinking about a Plan B to use up the energy credit you build up throughout the year and possibly to install more panels if you find yourself suddenly having to pay for electricity.
2. Tilt your panels toward the south (in the northern hemisphere) or toward the north (in the southern hemisphere) at the angle of your latitude.
3. Regularly rinse your panels to keep them clean and to maximize their output.
4. If the panels meet all of your electrical energy needs, that is, if energy consumption is close to energy generation, then the decision to switch to "Time of Use" metering makes sense only if the Winter Off Peak rate is so much lower than the Summer On Peak rate that some Plan B for using up the accrued credit becomes financially appealing.
5. Don't opt for "Time of Use" metering if your panels produce somewhat less than your electricity requirement during the winter, but more than you use during the summer because a slight change in rate of one period vs. another can make the difference between an annual energy credit and an unwelcome electricity bill. Moreover, if the electric company eliminates the method you have used to track your credit/debit status by introducing a "new and improved" electricity statement and/or a change in rate for one or more periods without prior announcement, you'll be, in our vernacular, up a creek without a paddle.
6. If your panels produce only a small fraction of the electrical energy you use throughout the year then do NOT switch to TOU metering. Doing so would subject you to the inflated "Summer On Peak" rate which at this writing is on the order of three times the flat rate.
Send a message to Oliver about this page? Click here.