Some Further
Observations
on
Photovoltaic Panels
by Oliver Seely
The text and photos on this page are in the public
domain.
Copying is encouraged!
Revised March 31, 2022
The following material was presented to the students in Professor Claudia Olivia
Espinosa Villegas' class ME 418 Renewable Energy and Sustainability in the Mechanical
Engineering Department at California State University Los Angeles on November 6, 2015. It
is an updated version of the web page
Some
Observations on Photovoltaic Cell Panels
This page has been translated into Spanish by Marglin Araujo:
Observaciones
sobre Paneles de Células Fotovoltaicas
Introduction
When measured against the plane of its orbit about the sun, the polar axis of the
earth is tilted by 23.4o. Los Angeles has a north latitude when measured from
the equator of 34.05o.
 At noon on the winter solstice, in order to face the sun at a 90o angle with its
surface, the plane of the surface would have to be tilted toward the south by the sum of these
two numbers, or around
57.45o. At noon on the summer solstice, the surface would have to be tilted by
the difference of these two values or around 10.65o. The average of these two
numbers is the same as our northern latitude of 34.05o , which represents an
average of the two extreme angles at noon on the winter and summer solstices. Suffice it to
say that at any point on the earth, to achieve a maximum average energy from the sun using
stationary panels, the panels ought to be tilted toward the equator at the angle of latitude.
At noon on the winter solstice, in order to face the sun at a 90o angle with its
surface, the plane of the surface would have to be tilted toward the south by the sum of these
two numbers, or around
57.45o. At noon on the summer solstice, the surface would have to be tilted by
the difference of these two values or around 10.65o. The average of these two
numbers is the same as our northern latitude of 34.05o , which represents an
average of the two extreme angles at noon on the winter and summer solstices. Suffice it to
say that at any point on the earth, to achieve a maximum average energy from the sun using
stationary panels, the panels ought to be tilted toward the equator at the angle of latitude.
 The decision to install photovoltaic panels hinges on where one lives. The amount
of sunlight
as determined by the climate of one's location and the ability to receive the direct rays of the
sun
when it
is shining helps one to decide if it makes sense to install the panels. On the left and right
are images showing available sunlight for the continental United States. The one on the right
gives the zones in units of kilowatt hours per square meter per day.
Although my home location in Lakewood, California would appear to be ideal because of the
available sunlight per year, in actual fact our distance from
the
Pacific
Ocean is only 12 km and coastal fog is a problem part of the year. On the average, the
amount of
sunlight
we get is limited to between 5 and 8 hours per day throughout the year (see the blue strip
along
the coast in the left image in front of the arrow tip).
The decision to install photovoltaic panels hinges on where one lives. The amount
of sunlight
as determined by the climate of one's location and the ability to receive the direct rays of the
sun
when it
is shining helps one to decide if it makes sense to install the panels. On the left and right
are images showing available sunlight for the continental United States. The one on the right
gives the zones in units of kilowatt hours per square meter per day.
Although my home location in Lakewood, California would appear to be ideal because of the
available sunlight per year, in actual fact our distance from
the
Pacific
Ocean is only 12 km and coastal fog is a problem part of the year. On the average, the
amount of
sunlight
we get is limited to between 5 and 8 hours per day throughout the year (see the blue strip
along
the coast in the left image in front of the arrow tip).
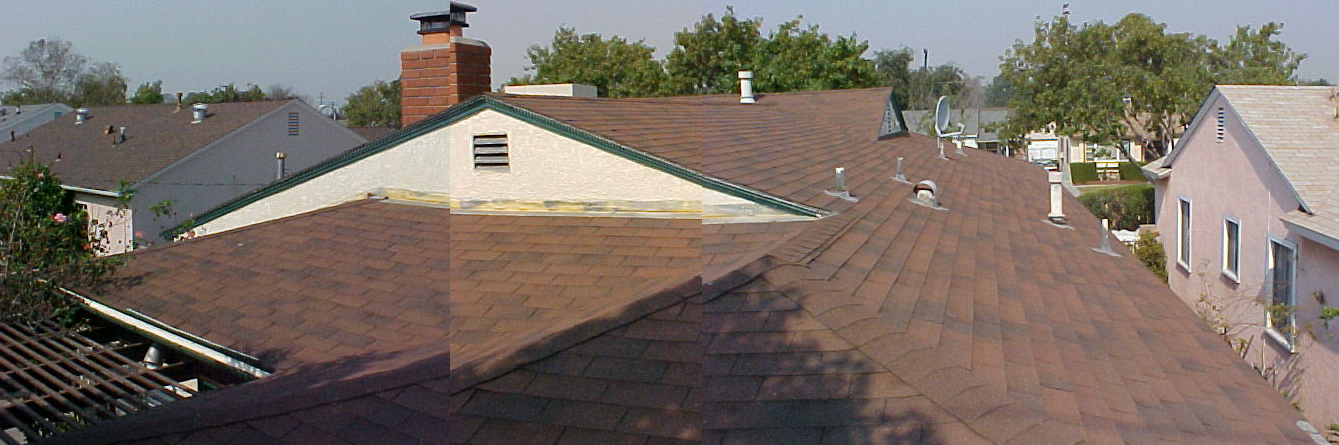 A roof sloping toward the south at our angle of latitude in full view of the sky would be ideal.
However, our roof line slopes toward the east and the west. There is a chimney near the
peak, as you can see.
A roof sloping toward the south at our angle of latitude in full view of the sky would be ideal.
However, our roof line slopes toward the east and the west. There is a chimney near the
peak, as you can see.
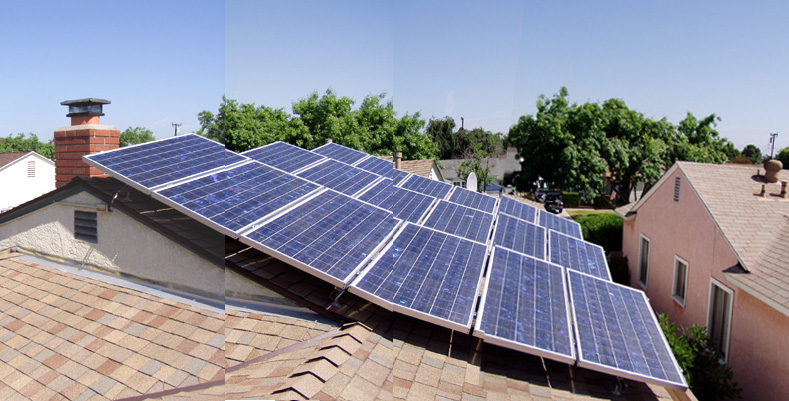 The panels have to be installed where there are no shadows during the day, so we installed
our system, rated at 3 kilowatts, on the east-sloping roof with an additional tilt toward the
south. There are 18 panels each rated at 165 watts which brings the system to a theoretical
maximum power output of 2970 watts or 2.97 kilowatts. Maximum
output occurs around 11 am each day that the sun shines.
The panels have to be installed where there are no shadows during the day, so we installed
our system, rated at 3 kilowatts, on the east-sloping roof with an additional tilt toward the
south. There are 18 panels each rated at 165 watts which brings the system to a theoretical
maximum power output of 2970 watts or 2.97 kilowatts. Maximum
output occurs around 11 am each day that the sun shines.
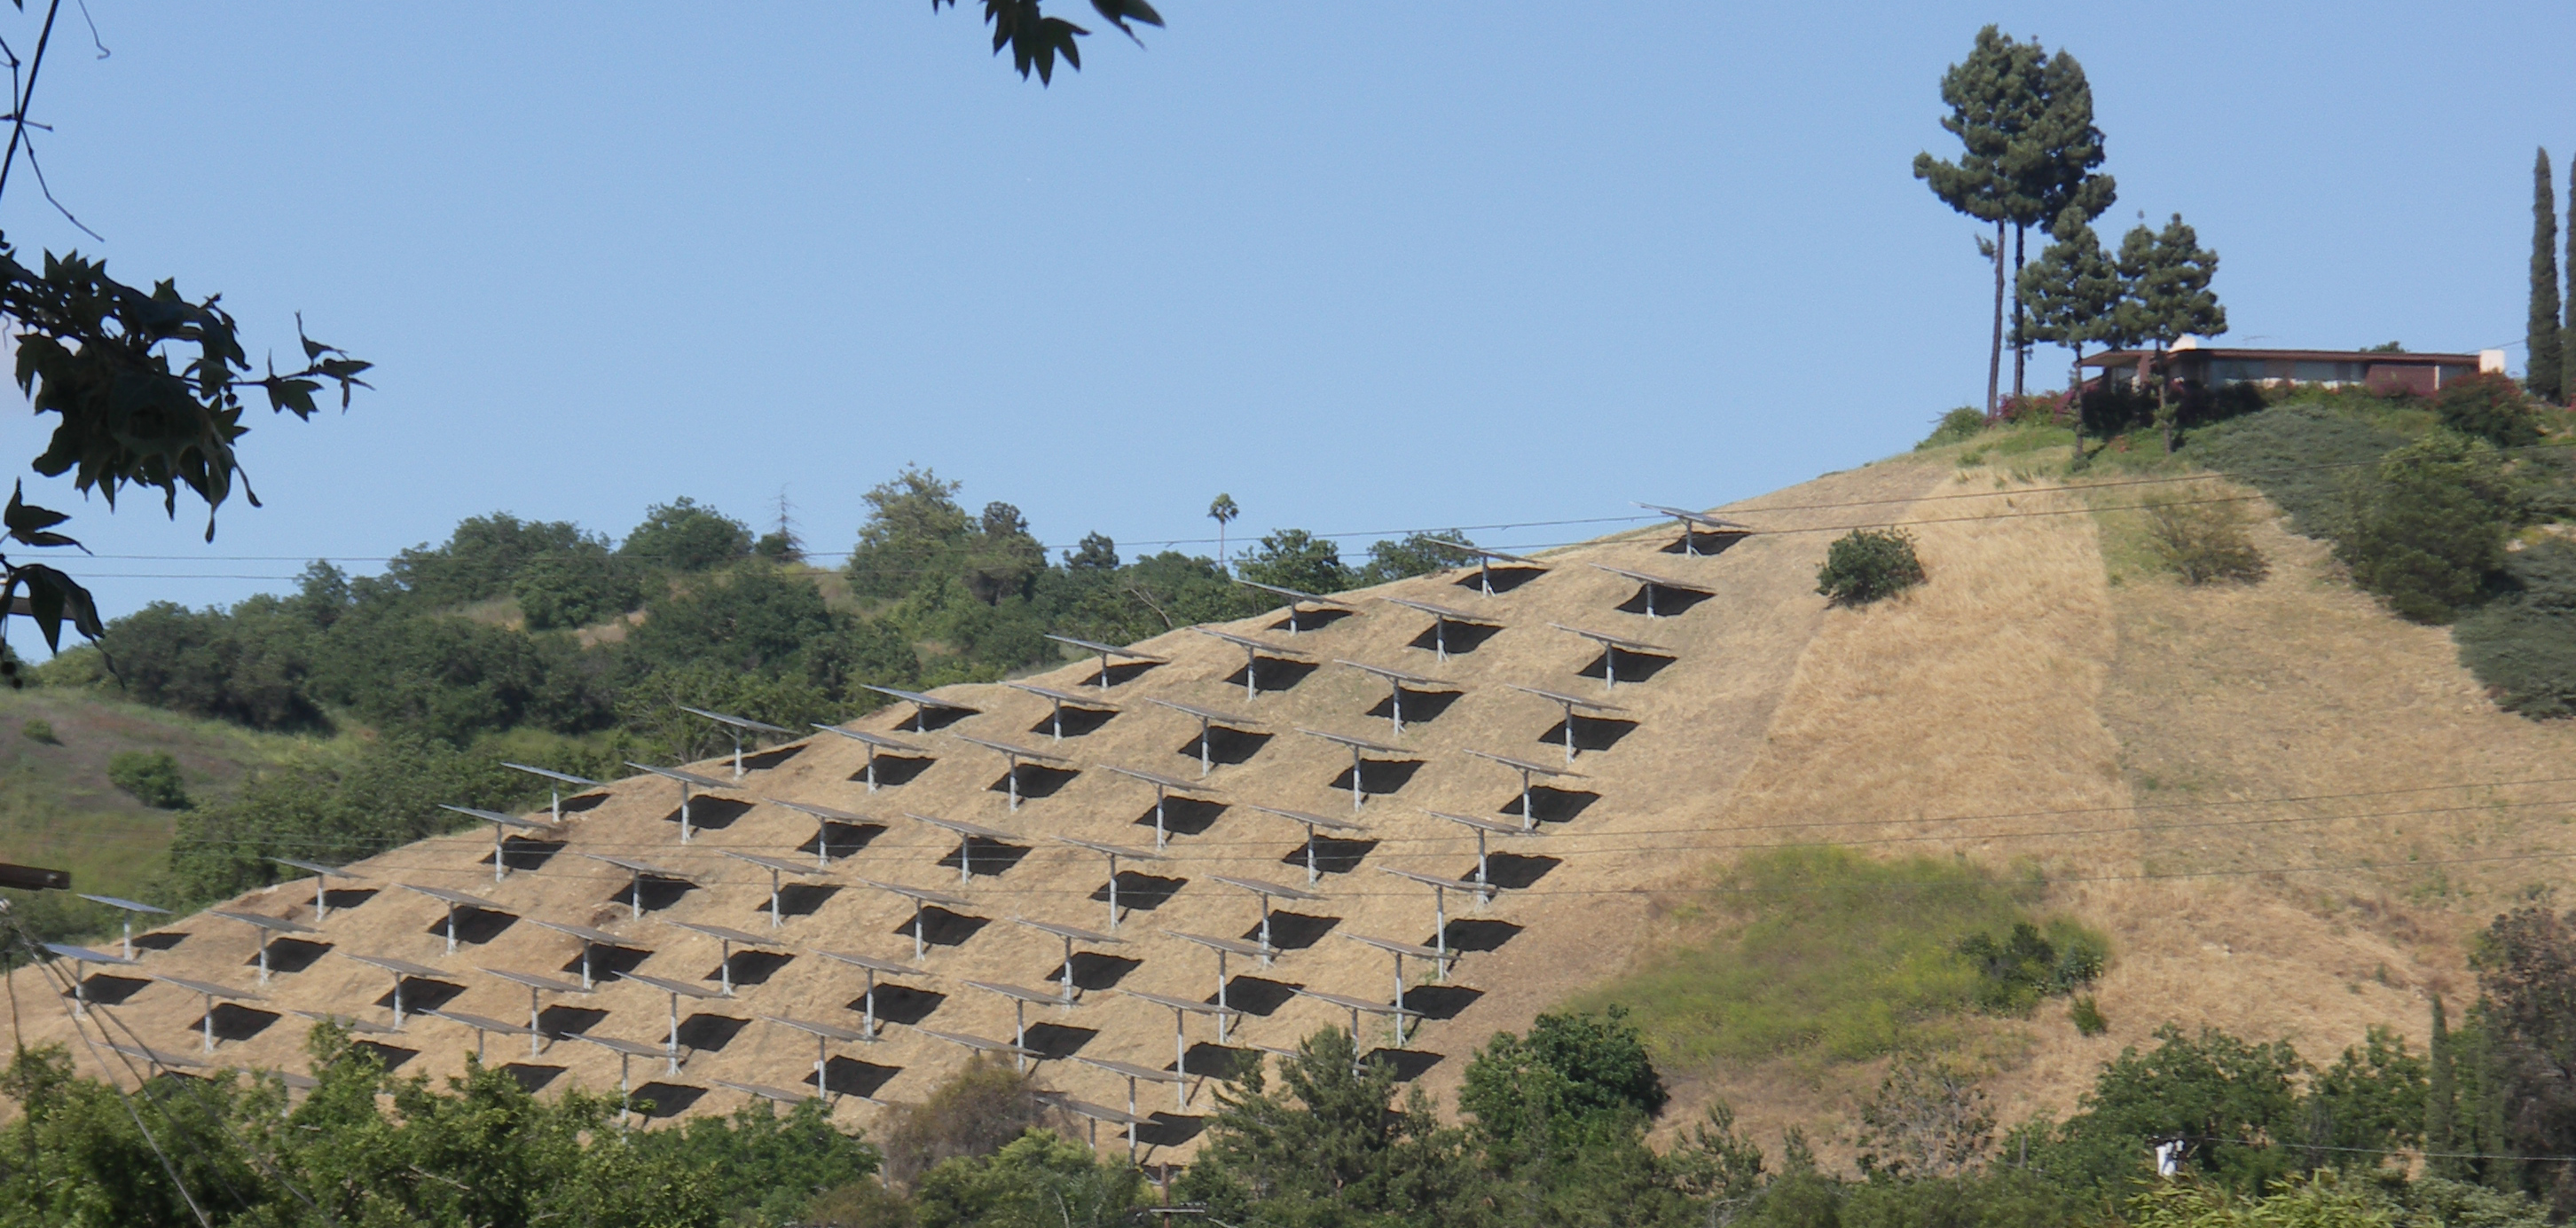
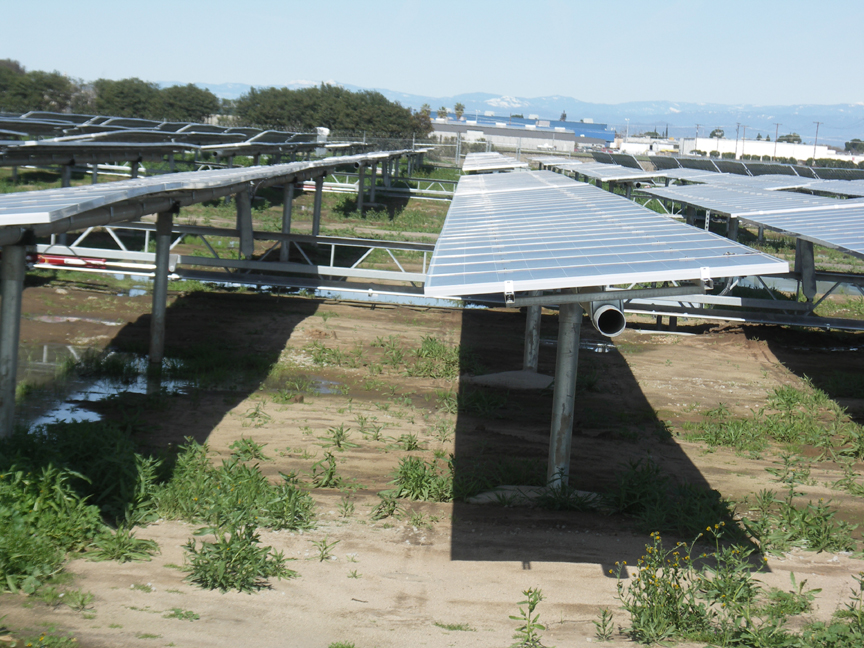
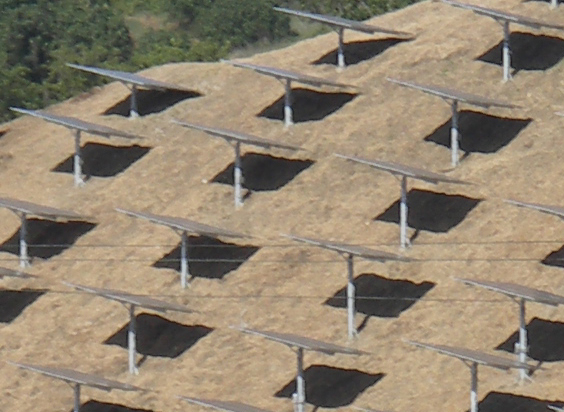 Even if one has a surface which slopes toward the north, things aren't hopeless. Here is a hill
sloping northward near the Pasadena Freeway which has ground-mounted solar panels
sloping
south.
Even if one has a surface which slopes toward the north, things aren't hopeless. Here is a hill
sloping northward near the Pasadena Freeway which has ground-mounted solar panels
sloping
south.
How much energy output can one expect?
Summary for Lakewood
Below is a table which shows the annual average consumption and the annual average
generation. The average annual generated energy in kilowatt hours comes to 2905, which is a
curious
coincidence because for our 3 kilowatt (rated) system, with not at all the most
advantageous tilt, our panels generate just under 3000 kilowatt hours of energy annually.
Were the tilt a bit more advantageous, the energy production would likely exceed 3000
kilowatt hours.
Were we a bit closer to the ocean, with more clouds and fog, the generated energy would be
somewhat less. But it is a good value to remember for estimating your own needs.
| Year |
Kilowatt hours consumed |
Kilowatt hours generated |
|
|
|
| 2005-2006 |
3053 |
2818 |
| 2006-2007 |
3257 |
2945 |
| 2007-2008 |
3409 |
3048 |
| 2008-2009 |
3445 |
2915 |
| 2009-2010 |
3235 |
2993 |
| 2010-2011 |
2553 |
2782 |
| 2011-2012 |
3060 |
2760 |
| 2012-2013 |
3490 |
3005 |
| 2013-2014 |
3474 |
2881 |
| 2014-2015 |
3774 |
2732 |
| 2015-2016 |
3878 |
2683 |
| 2016-2017 |
3274 |
2722 |
| 2017-2018 |
3651 |
2558 |
| 2018-2019 |
3862 |
3814 |
| 2019-2020 |
2161 |
3062 |
| 2023 |
|
3379 |
| 2024 |
|
2416 |
| 2025 |
|
|
A second installation of solar panels was approved by the utility in 2020 and the true-up period
was restarted on January 1, 2020. Until we have good data on the excess solar energy generated
and the $ credit actually received for it, we will not be able to plan whether, or how best to use,
that energy.
| Year |
Kilowatt hours consumed |
Kilowatt hours generated |
|
|
|
| 2020 |
TBA |
TBA |
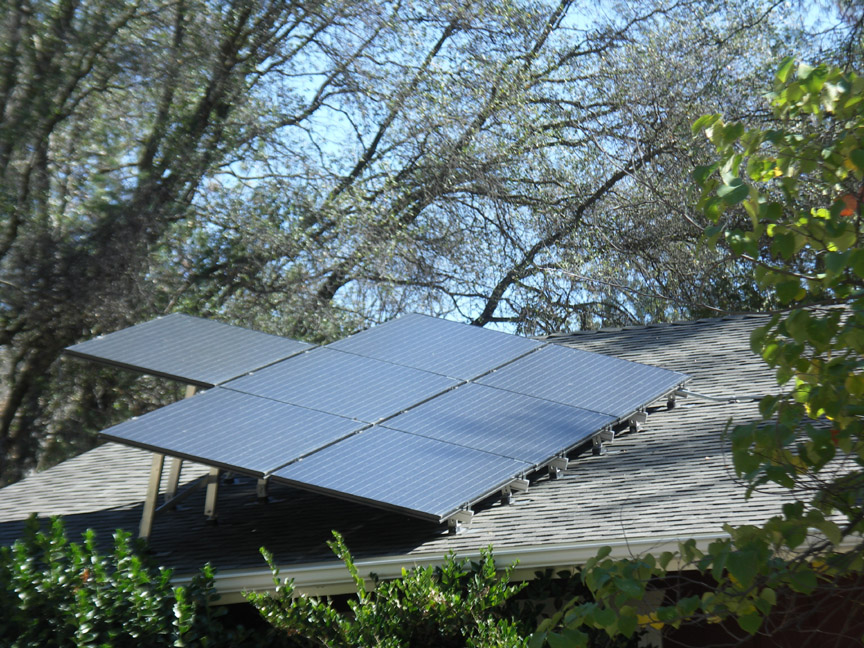
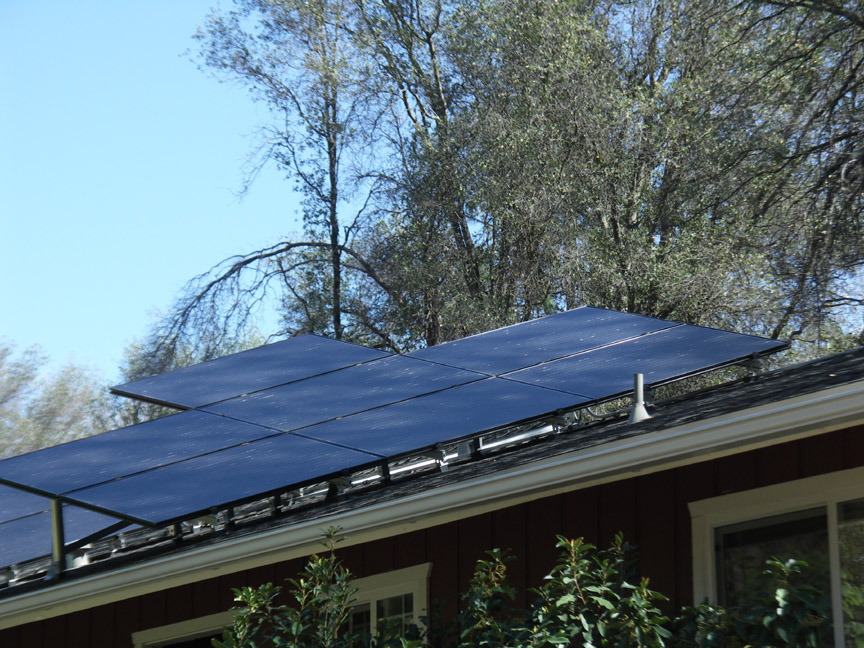
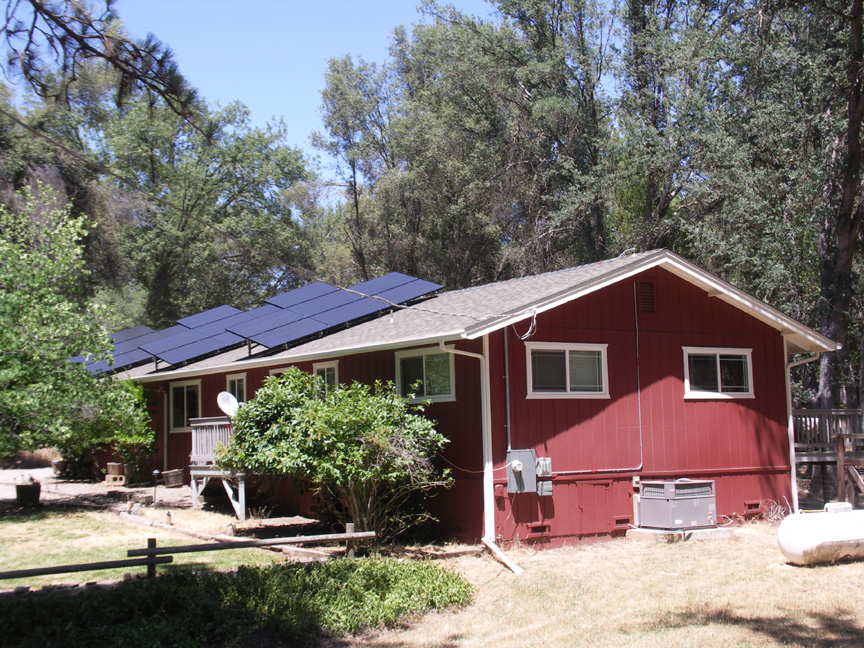 At our vacation home near Yosemite National Park we have the same problem with the roof
line as in Lakewood: it tilts east and west rather than north and south, but at this location
there are high trees on the eastern side, as you can see, so it made more sense to put the panels
on the west side so that they receive full sunlight earlier in the day. The tilt to the south is at
about the same angle as the panels in Lakewood.
At our vacation home near Yosemite National Park we have the same problem with the roof
line as in Lakewood: it tilts east and west rather than north and south, but at this location
there are high trees on the eastern side, as you can see, so it made more sense to put the panels
on the west side so that they receive full sunlight earlier in the day. The tilt to the south is at
about the same angle as the panels in Lakewood.
 On the basis of shading by trees on all three sides, east, south and west, and except for space
heating, it is an all electric house, our installer recommended that we go for a 5 kw system.
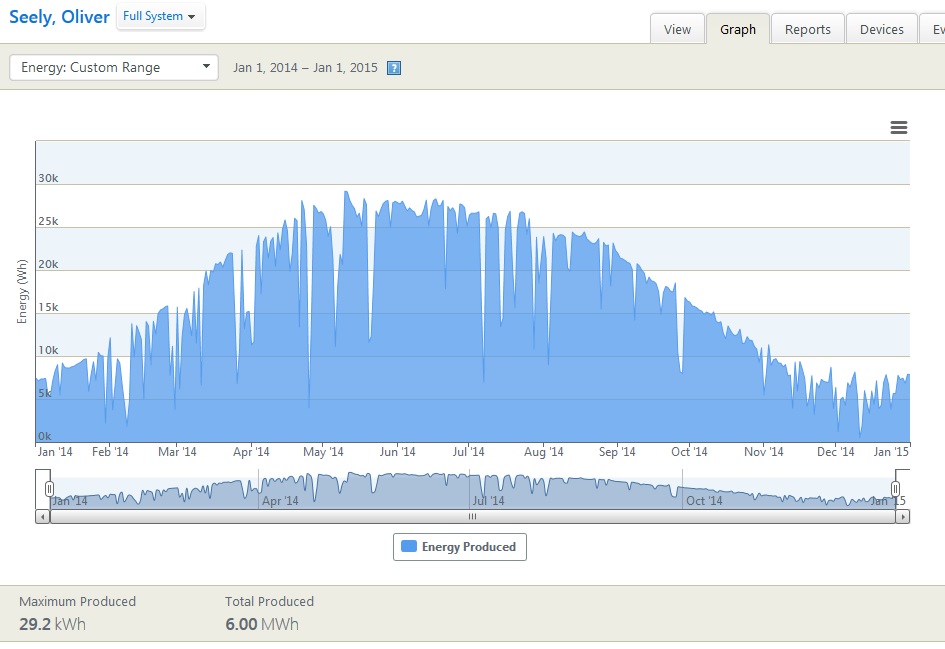
We have 21 panels rated at 245 watts each, or 21x245 = 5145 watts or 5.145 kw. What kind
of annual output does that give us? The system was installed in July of 2013, so at this time
we have just over one full year of output to measure. Note that from January 1, 2014
to January 1, 2015, the plot shows a total energy output from the panels of 6.00 megawatt
hours, or 6000 kilowatt hours. So our 5145 watt system produces 6000 kilowatt hours of
energy. The increased relative amount of energy generation over our panels in Lakewood is
likely the result of higher
elevation, more ultraviolet light and more sunny days in spite of the shading by the
surrounding trees.
On the basis of shading by trees on all three sides, east, south and west, and except for space
heating, it is an all electric house, our installer recommended that we go for a 5 kw system.
We have 21 panels rated at 245 watts each, or 21x245 = 5145 watts or 5.145 kw. What kind
of annual output does that give us? The system was installed in July of 2013, so at this time
we have just over one full year of output to measure. Note that from January 1, 2014
to January 1, 2015, the plot shows a total energy output from the panels of 6.00 megawatt
hours, or 6000 kilowatt hours. So our 5145 watt system produces 6000 kilowatt hours of
energy. The increased relative amount of energy generation over our panels in Lakewood is
likely the result of higher
elevation, more ultraviolet light and more sunny days in spite of the shading by the
surrounding trees.
On the other hand, the shading produces random effects on the output of individual panels
throughout the day and with the change of seasons. There are three banks of panels with
seven panels each. Here is the energy output for each panel during the day of October 12,
2015 in watt-hours. The first seven numbers are for the north bank, the second seven for the
middle and the final seven for the south bank.
840, 752, 574, 853, 944, 667, 582, 547, 747, 500, 971, 567, 905, 574, 753, 675, 643, 691,
862, 913, 536
Note the high output for one panel of 971 wH and a low output of another at 500 wH. A
member of the PV Panel discussion group was alarmed enough to suggest that I look into the
matter because he had seen a similar disparity in his installation because of a connection
problem.
As the sun comes up the shading of each panel attenuates the output of each panel according
to the wind pattern on the branches, the time of day and the season. Here are two photos
taken on October 16, 2015 of shading on the north and south banks around 11am.
So as the shadows of the branches move across the panels one ends up getting a pretty large
variation in output during the day. Whereas two single panels during one day might have a
disparity of nearly 50% (971 vs. 500), the same isn't seen for a monthly output. Within an
individual bank, the minimum to maximum output approaches 85% during the winter and
around 90% during the summer. There is an expected trend for the banks during the winter,
but opposite of what one expect during the summer..
| Bank of Modules |
December, 2014, kwH |
July, 2015, kwH |
|
|
|
| North Bank |
9.39 |
35.1 |
| Middle Bank |
8.31 |
35.8 |
| South Bank |
6.83 |
38.6 |
| Total |
171.67 |
766.7 |
In December, the south bank has the lowest output because of the shading by the trees on the
south side of the property. Had we installed the southernmost bank where the installers first
began to drill holes much nearer the south wall of the building, we would have seen an even
greater attenuation during the winter. Curiously, the monthly output for July shows a slightly
greater output for the south bank. However when one looks at the output of individual
panels, any connection problem, if there is one, is masked by the random output due to daily
shading.
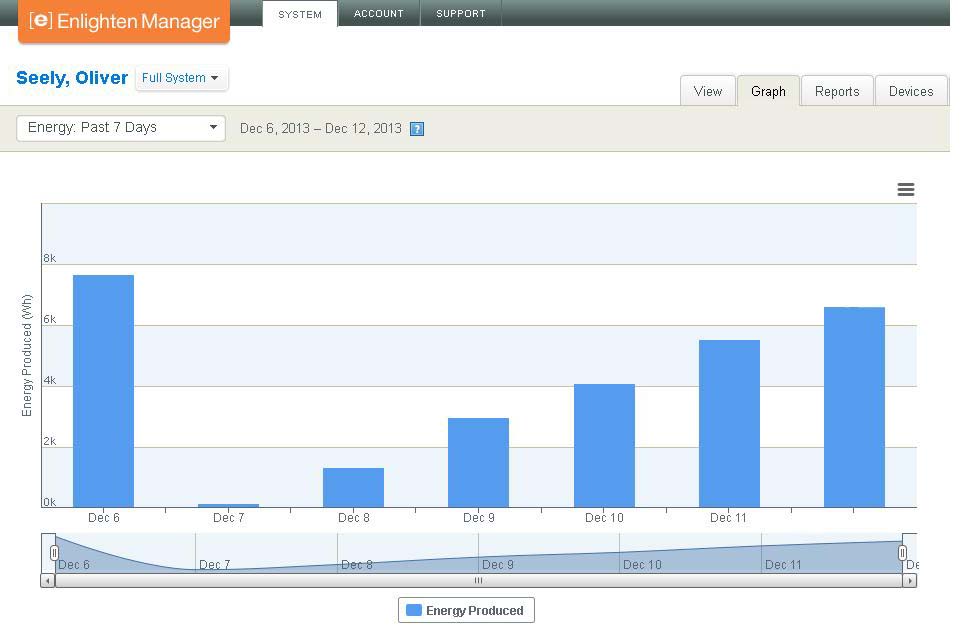
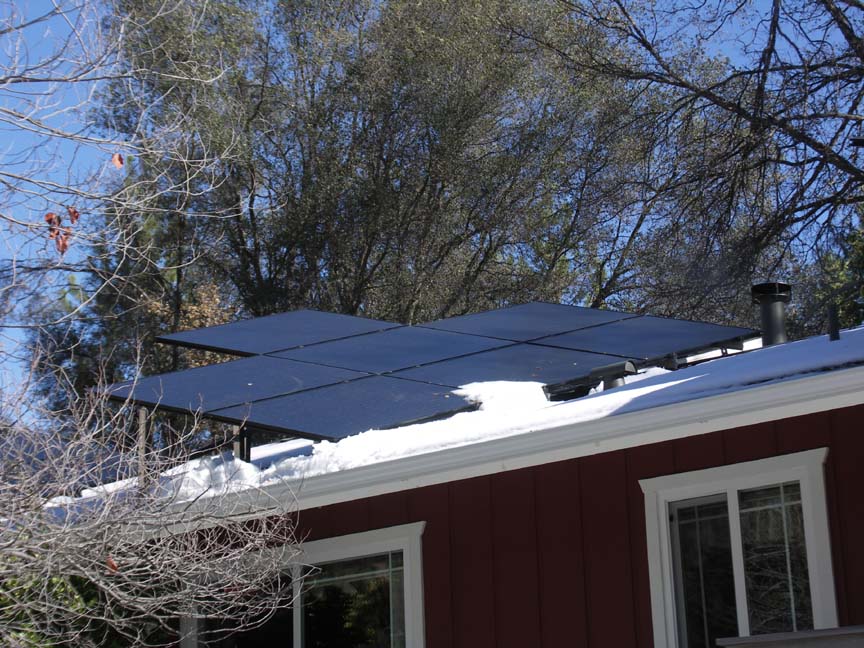 It does snow from time to time at our elevation in the mountains and when I checked the
histogram on December 7, 2013 from Lakewood, I went into a panic. It looked like my
panels had stopped operating. We weren't planning to be up there for several more days so it
was with some relief that each day the output progressed upward to give us the graph on the
right after a week. When we arrived the snow had almost completely melted.
It does snow from time to time at our elevation in the mountains and when I checked the
histogram on December 7, 2013 from Lakewood, I went into a panic. It looked like my
panels had stopped operating. We weren't planning to be up there for several more days so it
was with some relief that each day the output progressed upward to give us the graph on the
right after a week. When we arrived the snow had almost completely melted.
Tracking the Sun?
Here's a system of panels at the Fresno Yosemite International Airport. The point of view of
the camera which took this photo is directly north. The banks of panels rotate east to west
(right to left) during the day so as to achieve
maximum output with the position of the sun. But the panels have a horizontal axis, so there
is no advantage achieved by tilting at the angle of latitude. Note the cantilevered structure
which seems to be attached to a structural member on the left bank of panels. It appears to be
perpendicular to them and is the member which changes their tilt, either by movement of the
cantilevered structure or a chain in a bed on top of
it.
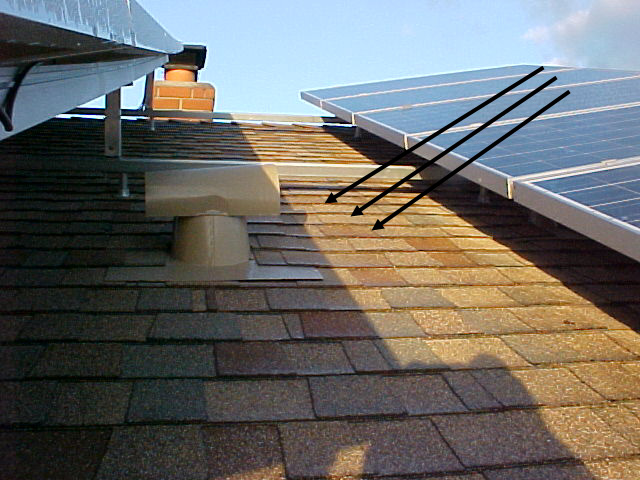
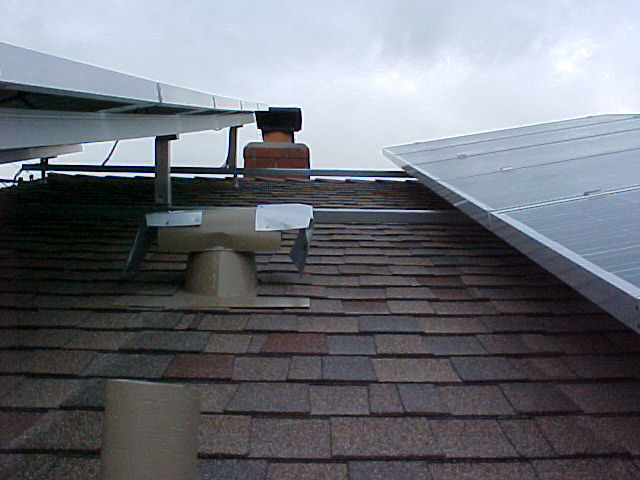 Structural modifications of any kind carry the risk of unintended consequences. Our
installation in Lakewood
caused a leak through the bathroom vent during heavy rain as a result of runoff onto the roof
and subsequent
splashing into the vent. The vent was modified by adding a shield, as shown. Ugly though it
may
be, it did the trick as demonstrated by another rainstorm shortly after its installation.
Structural modifications of any kind carry the risk of unintended consequences. Our
installation in Lakewood
caused a leak through the bathroom vent during heavy rain as a result of runoff onto the roof
and subsequent
splashing into the vent. The vent was modified by adding a shield, as shown. Ugly though it
may
be, it did the trick as demonstrated by another rainstorm shortly after its installation.
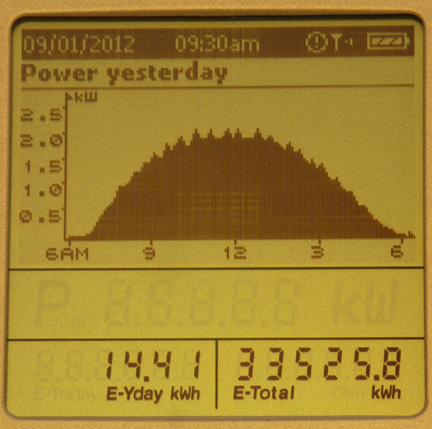 The Lakewood installation uses a single inverter, with direct current flowing to it and
"inverted" using a variable oscillator controlled by the frequency of the grid, which averages
60 cycles per second or 60 Hertz. Each morning the controller goes through its countdown,
synchronizing the inverter phase with that of the grid. When it locks into the phase of the
grid the system goes online and electricity begins to flow from the panels. During the day I
get the readout shown at the right which graphs my kilowatts of power during the day and
logs the total energy produced at the lower left.
We estimate that it will take 14 years to recoup our out of pocket expenses. Richard Corkish
of the Photovoltaics Special Research Centre at the University of New South Wales estimates
that it will take between 3 and 7 years to produce enough energy to equal that amount
contained in the non-renewable fossil fuels used to fabricate the panels. That estimate can be
found in his offering,
Can Solar Cells Ever Recapture the Energy
Invested in their Manufacture?
The Lakewood installation uses a single inverter, with direct current flowing to it and
"inverted" using a variable oscillator controlled by the frequency of the grid, which averages
60 cycles per second or 60 Hertz. Each morning the controller goes through its countdown,
synchronizing the inverter phase with that of the grid. When it locks into the phase of the
grid the system goes online and electricity begins to flow from the panels. During the day I
get the readout shown at the right which graphs my kilowatts of power during the day and
logs the total energy produced at the lower left.
We estimate that it will take 14 years to recoup our out of pocket expenses. Richard Corkish
of the Photovoltaics Special Research Centre at the University of New South Wales estimates
that it will take between 3 and 7 years to produce enough energy to equal that amount
contained in the non-renewable fossil fuels used to fabricate the panels. That estimate can be
found in his offering,
Can Solar Cells Ever Recapture the Energy
Invested in their Manufacture?
Panel Maintenance
The panels are
guaranteed for 25 years. The good news is that the panels work silently with no moving
parts,
pumping excess
electrical energy routinely into the
electrical grid when we use less than that which is generated.
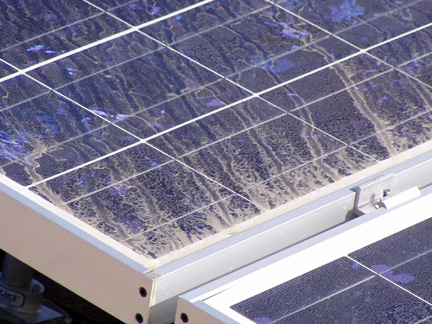
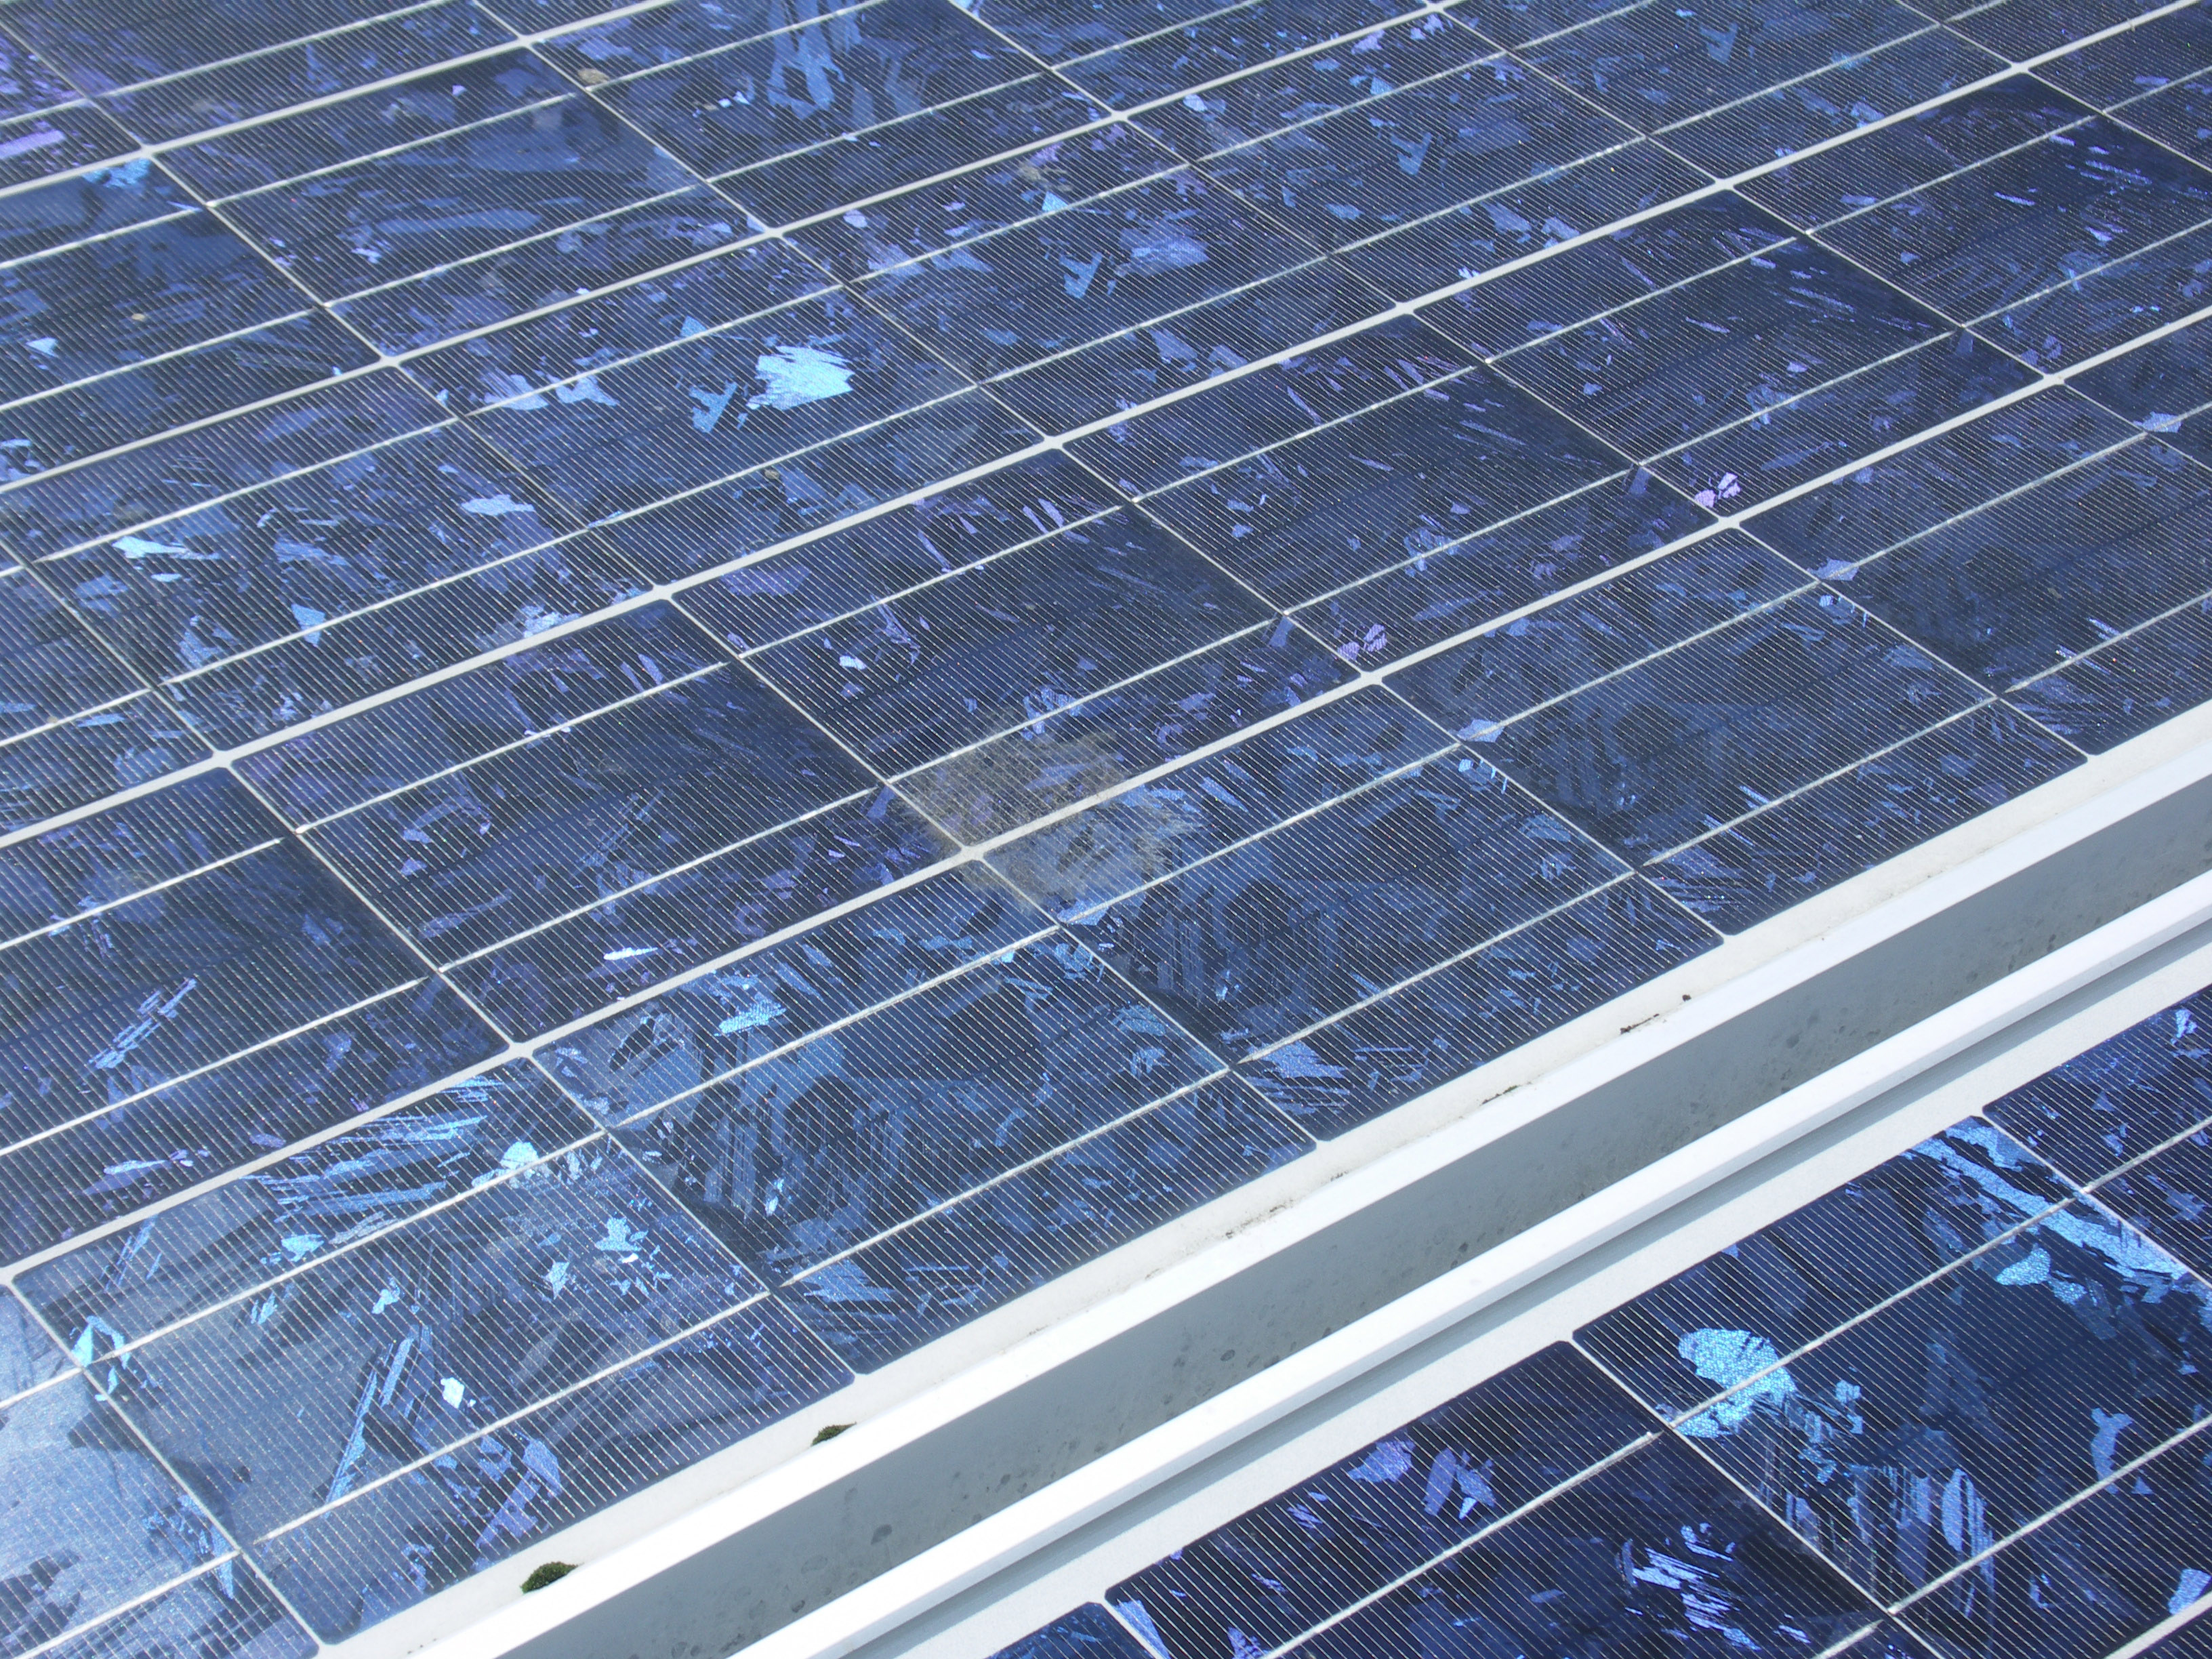
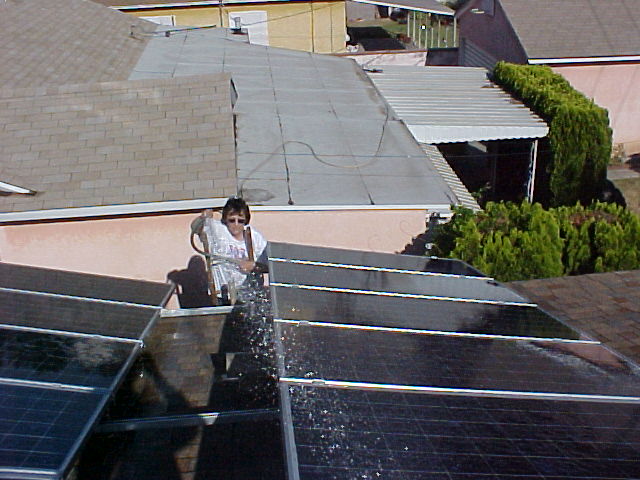 The bad
news is that over time in an urban area where there is a lot of dustfall, the efficiency drops.
In the Los Angeles area several
months can go by without rain. These images show what happens after such a
period. We have found it advisable to do a once-a-month rinsing of the panels to make them
sparkling clean and to bring them back to maximum
efficiency.
The bad
news is that over time in an urban area where there is a lot of dustfall, the efficiency drops.
In the Los Angeles area several
months can go by without rain. These images show what happens after such a
period. We have found it advisable to do a once-a-month rinsing of the panels to make them
sparkling clean and to bring them back to maximum
efficiency.
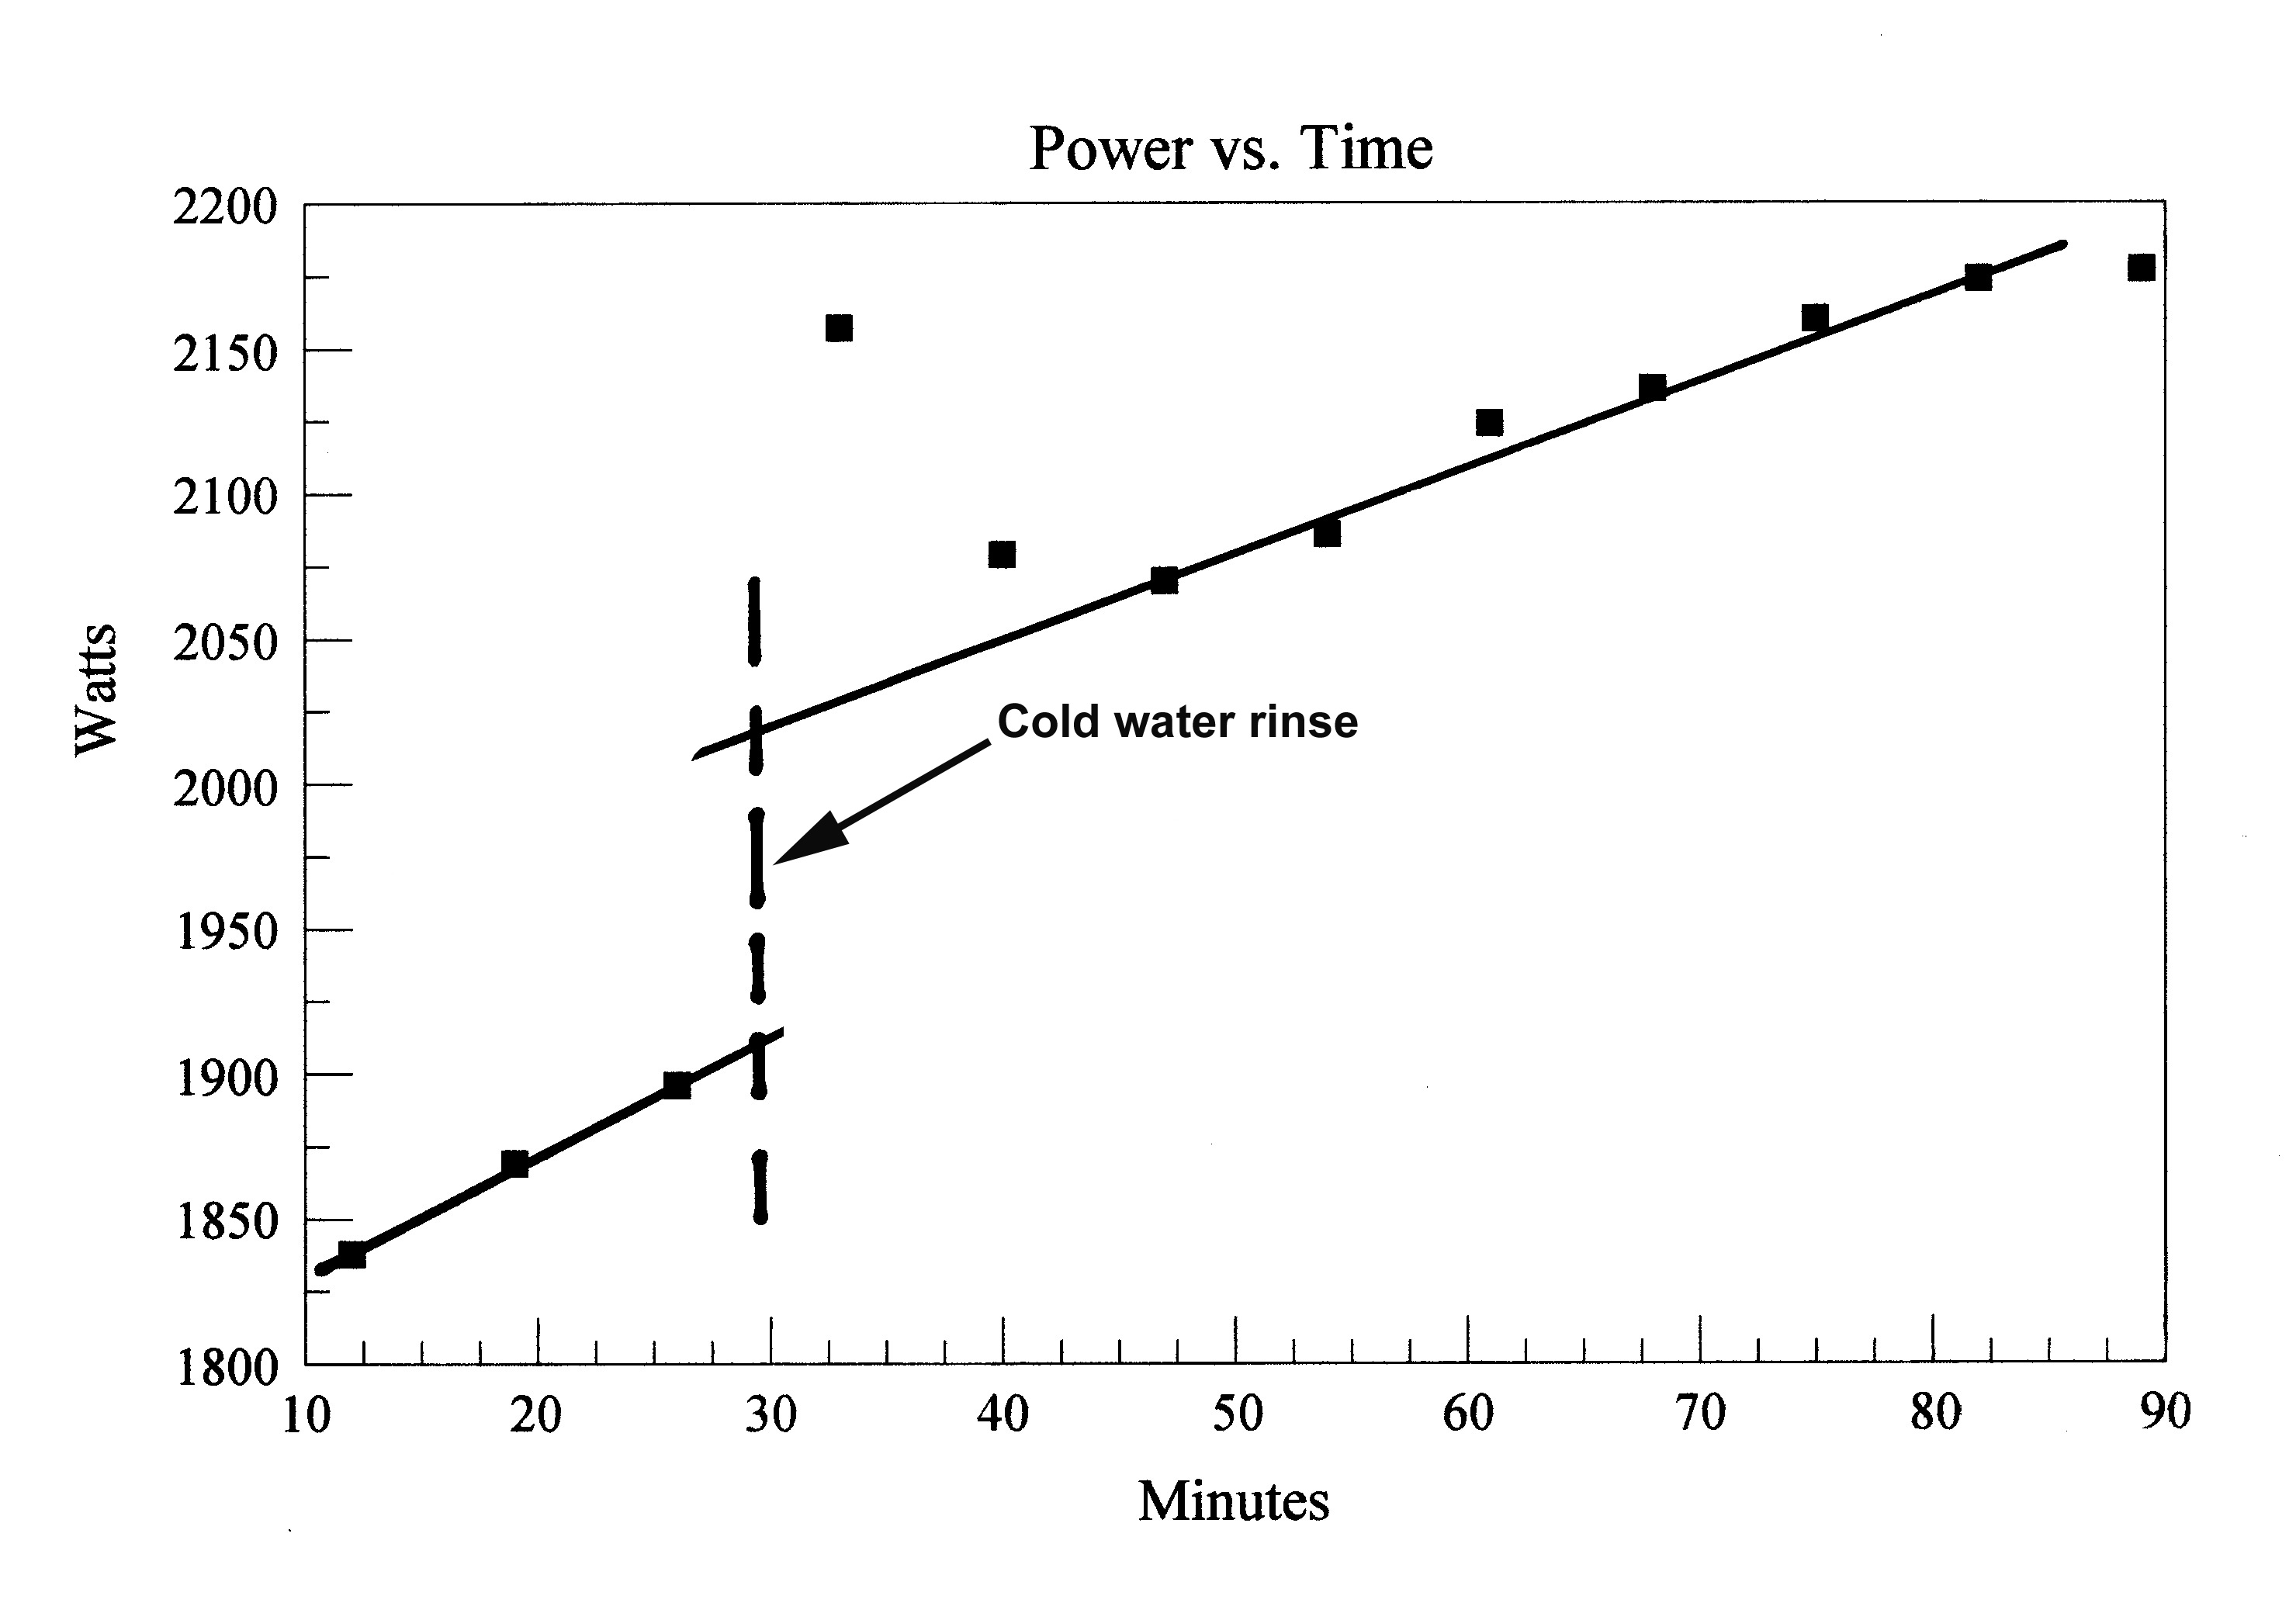
What happens to the energy output when the panels are rinsed? The data for the rinsing
below were taken starting at 9:12 am on a cloudless midsummer morning, 2006. The cold
water rinse was effected between readings taken at 9:26 and 9:33.
The previous rinse had been done about a month before this one. There had been no rain
between
rinses.
When graphed, the extrapolated intersections with the time when the rinse was effected
amounts to the difference between 1900 and 2000 kw, a power increase of around 5%. The
initial high power output is caused by increased efficiency of the panels at the low
temperature
of the cold rinse water.
| Time |
Power
output
(watts) |
| 9:12 |
1838 |
| 9:19 |
1869 |
| 9:26 |
1896 |
cold
water
rinse |
xxxx |
| 9:33 |
2157 |
| 9:40 |
2079 |
| 9:47 |
2070 |
| 9:54 |
2086 |
| 10:01 |
2124 |
| 10:08 |
2136 |
| 10:15 |
2160 |
| 10:22 |
2174 |
| 10:29 |
2177 |
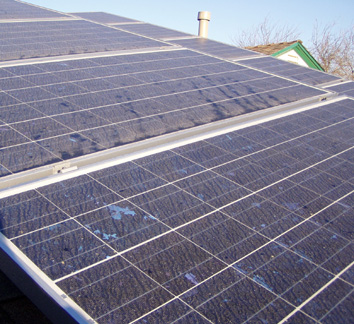 Here's an image taken of the panels after two months without rain. My guess is that the drop
in power output was somewhere around 10%.
Here's an image taken of the panels after two months without rain. My guess is that the drop
in power output was somewhere around 10%.
How much water?
I was asked recently about water needs for panels installed in some of the desert regions of
California. The frequency of rinsing depends on the dustfall of the region, so any projection
of
needs requires a measurement of dustfall and a comparison with areas for which the dustfall
and
accompanying energy loss is known, but the rinsing frequency is a judgment call based on
that
energy loss which one is willing to tolerate. My once-per-month rinsing during the dry
season in
suburban Los Angeles seems to coincide with an energy loss of 5-10%. The "case study"
rinsing
frequency (below) seems to be based on an energy loss of 15% to trigger a rinse. A typical
rinse
of my 18 panels using the method shown in the photo above requires 1.21 cu. ft. of water.
The
rinse consists of a first pass "to soften up" the layer of dust and bird droppings followed by a
second pass to remove the softened residue. 1.21 cu. ft. = 9.05 gallons (U.S., liq.) = 34.3
liters.
A careful measurement of volume needed and the noble expectation that one will be able to
claim that the runoff will go into one's garden is shattered when one observes the runoff lying
in
the rain gutter behind a pile of leaves and evaporating slowly. I leave it to the reader to make
the
calculations needed for his or her application. Suffice it to say that my method is just about
the
most inefficient one could use. An industrial operation would have an advantage of scale and
recycling potential.
Particulate matter
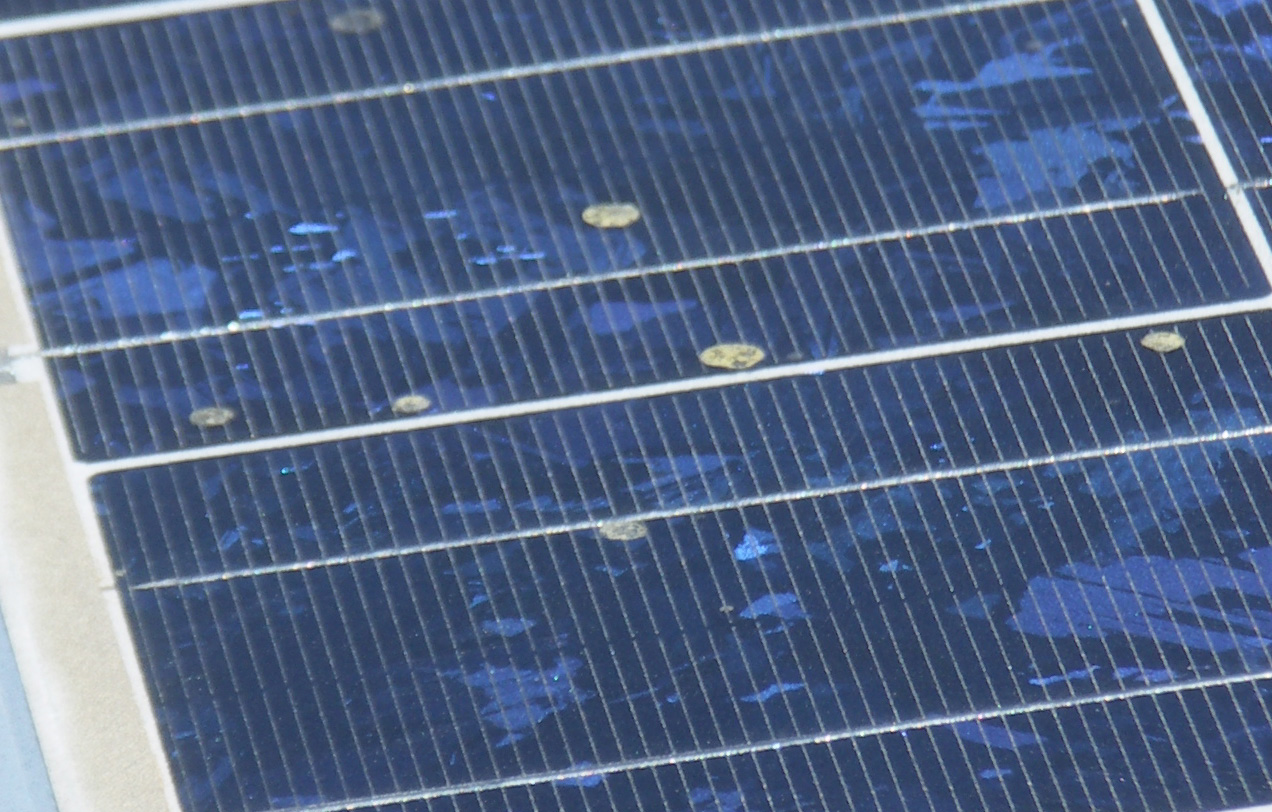 All kinds of stuff falls routinely from the sky: meteorites, cosmic dust and used satellites for
starters. At our house in southern California and near an airport we get little spots of yellow
gunk which produces opaque spots on the solar panels. It has the consistency of dust particles
mixed with oil judging from the way it scrapes off the panels. There is a web page which
claims the spots are bee poop. I don't know. Maybe so. Fortunately the ultraviolet light
breaks enough of the chemical bonds in whatever binds the particles together to allow them
finally to sluff off during repeated rinsings. Still, they do represent a potential fall-off of
energy
generated by one's installation.
All kinds of stuff falls routinely from the sky: meteorites, cosmic dust and used satellites for
starters. At our house in southern California and near an airport we get little spots of yellow
gunk which produces opaque spots on the solar panels. It has the consistency of dust particles
mixed with oil judging from the way it scrapes off the panels. There is a web page which
claims the spots are bee poop. I don't know. Maybe so. Fortunately the ultraviolet light
breaks enough of the chemical bonds in whatever binds the particles together to allow them
finally to sluff off during repeated rinsings. Still, they do represent a potential fall-off of
energy
generated by one's installation.
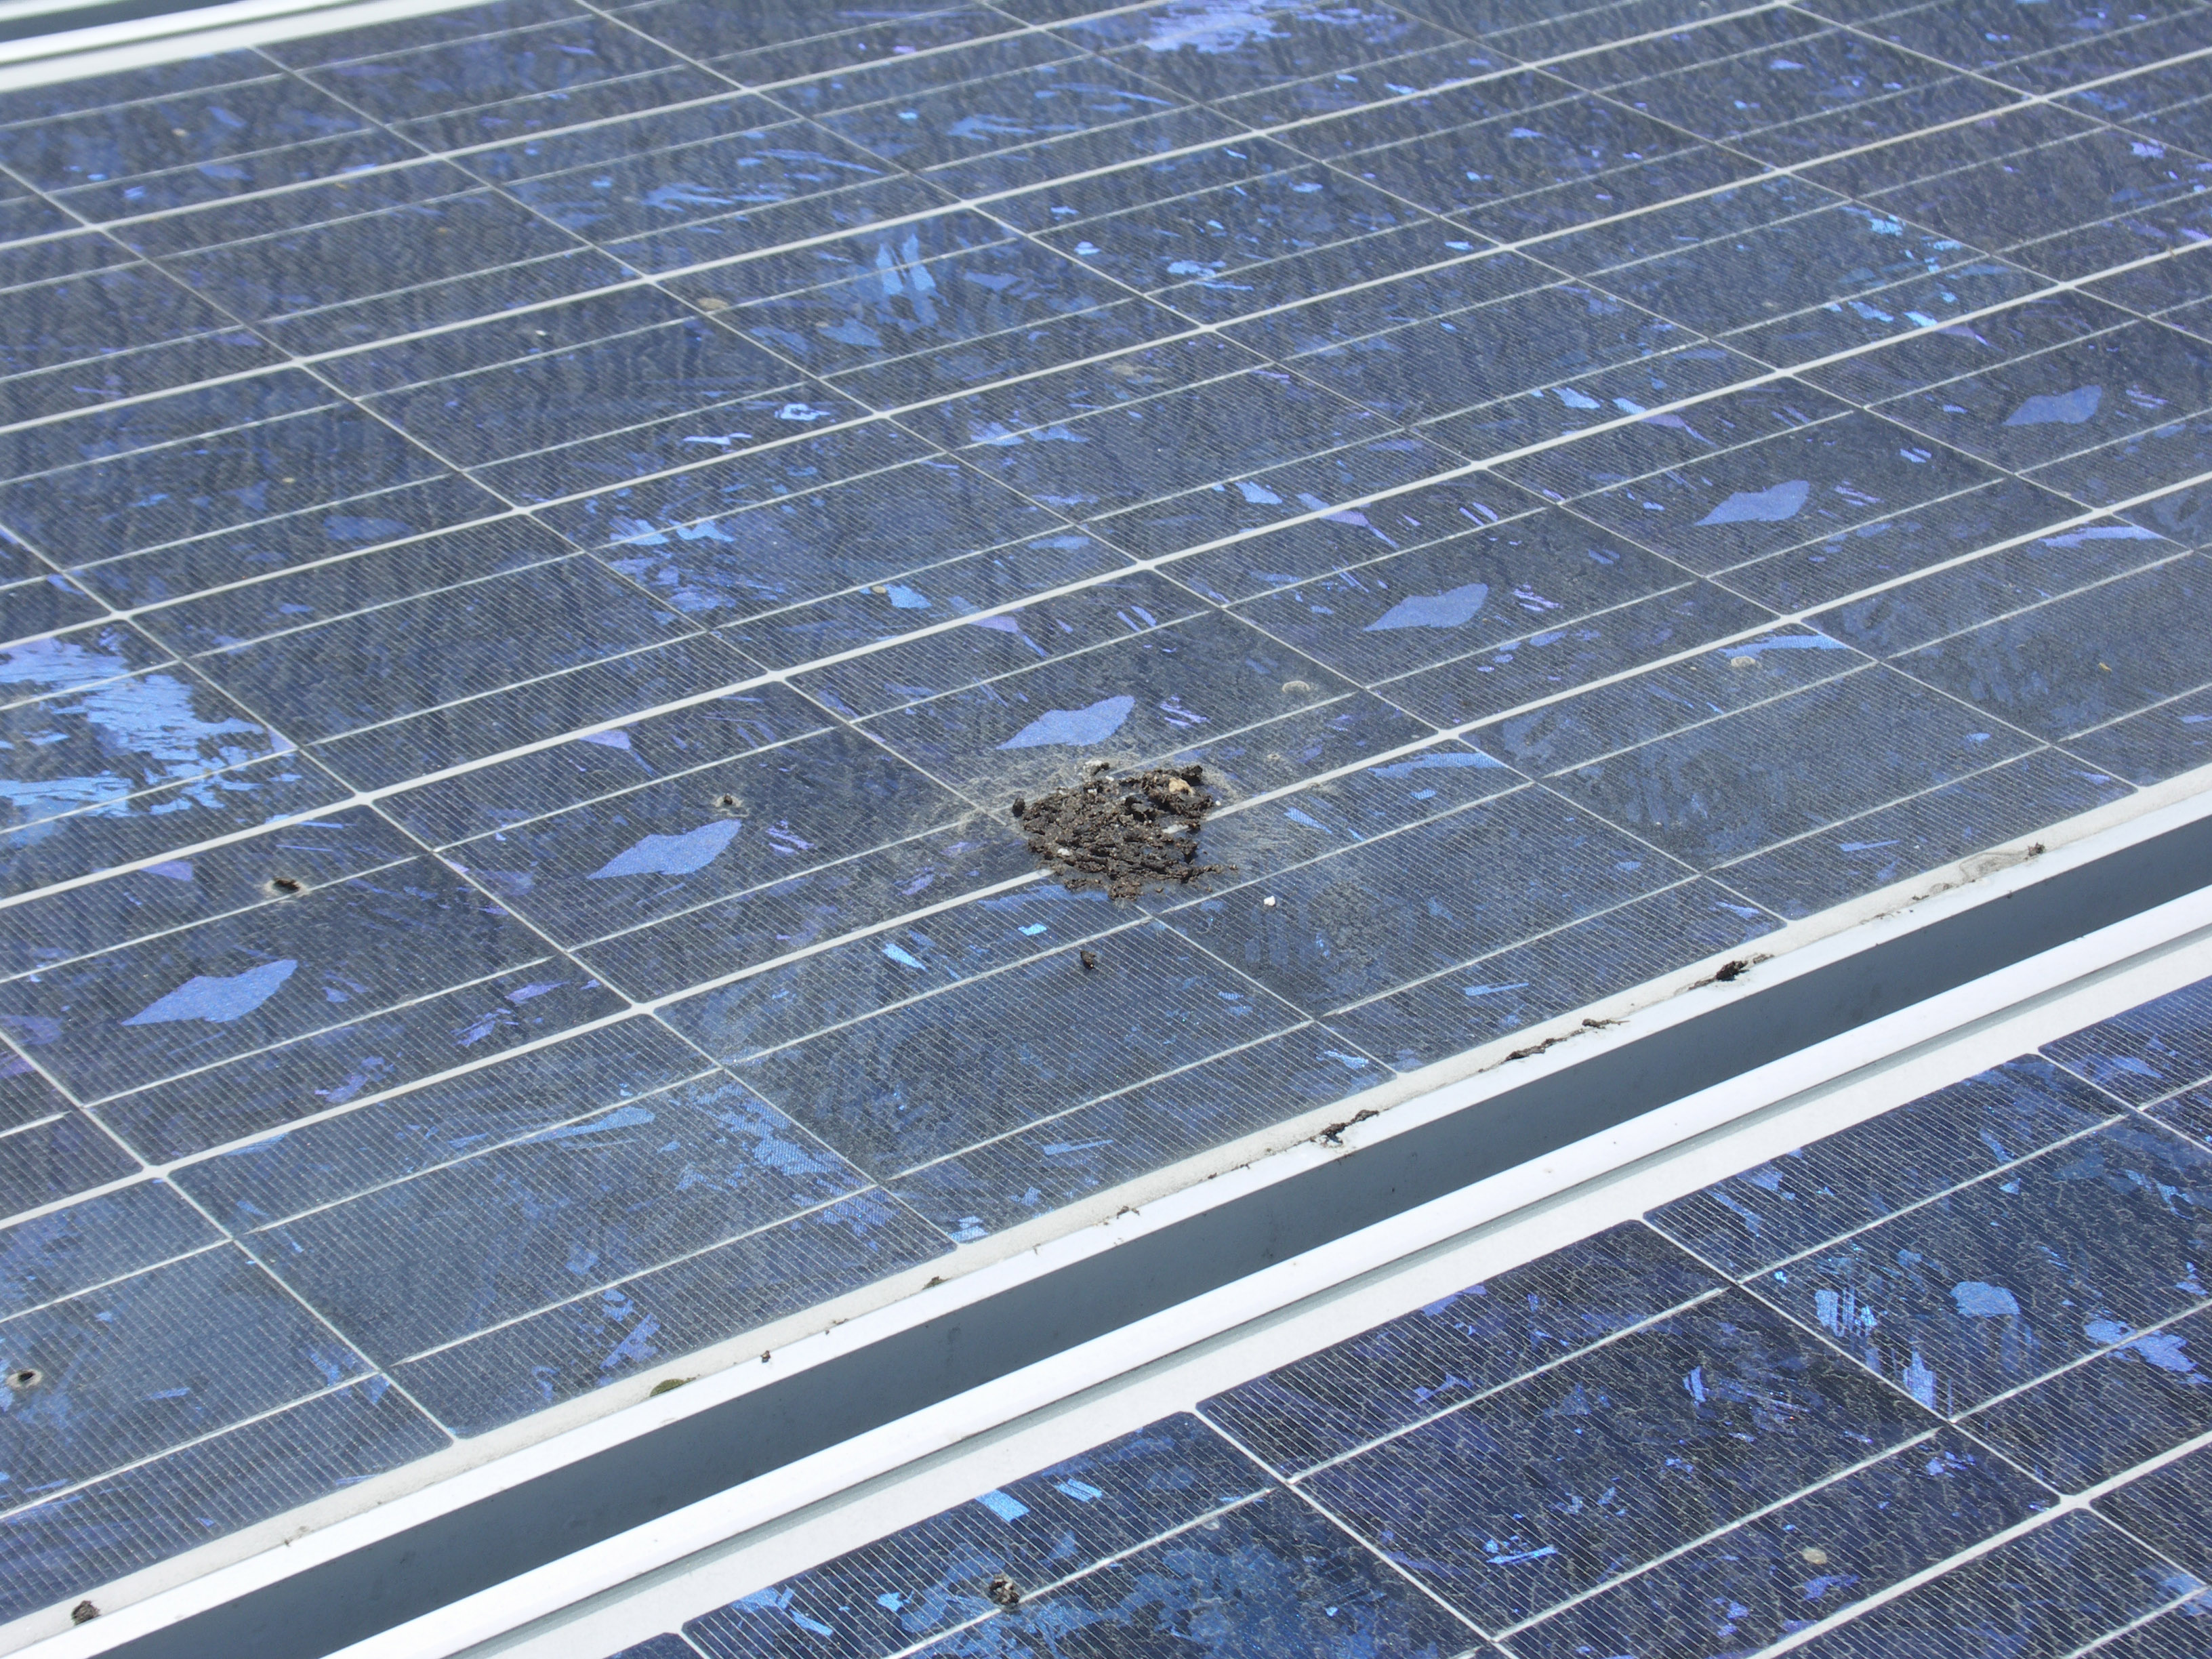
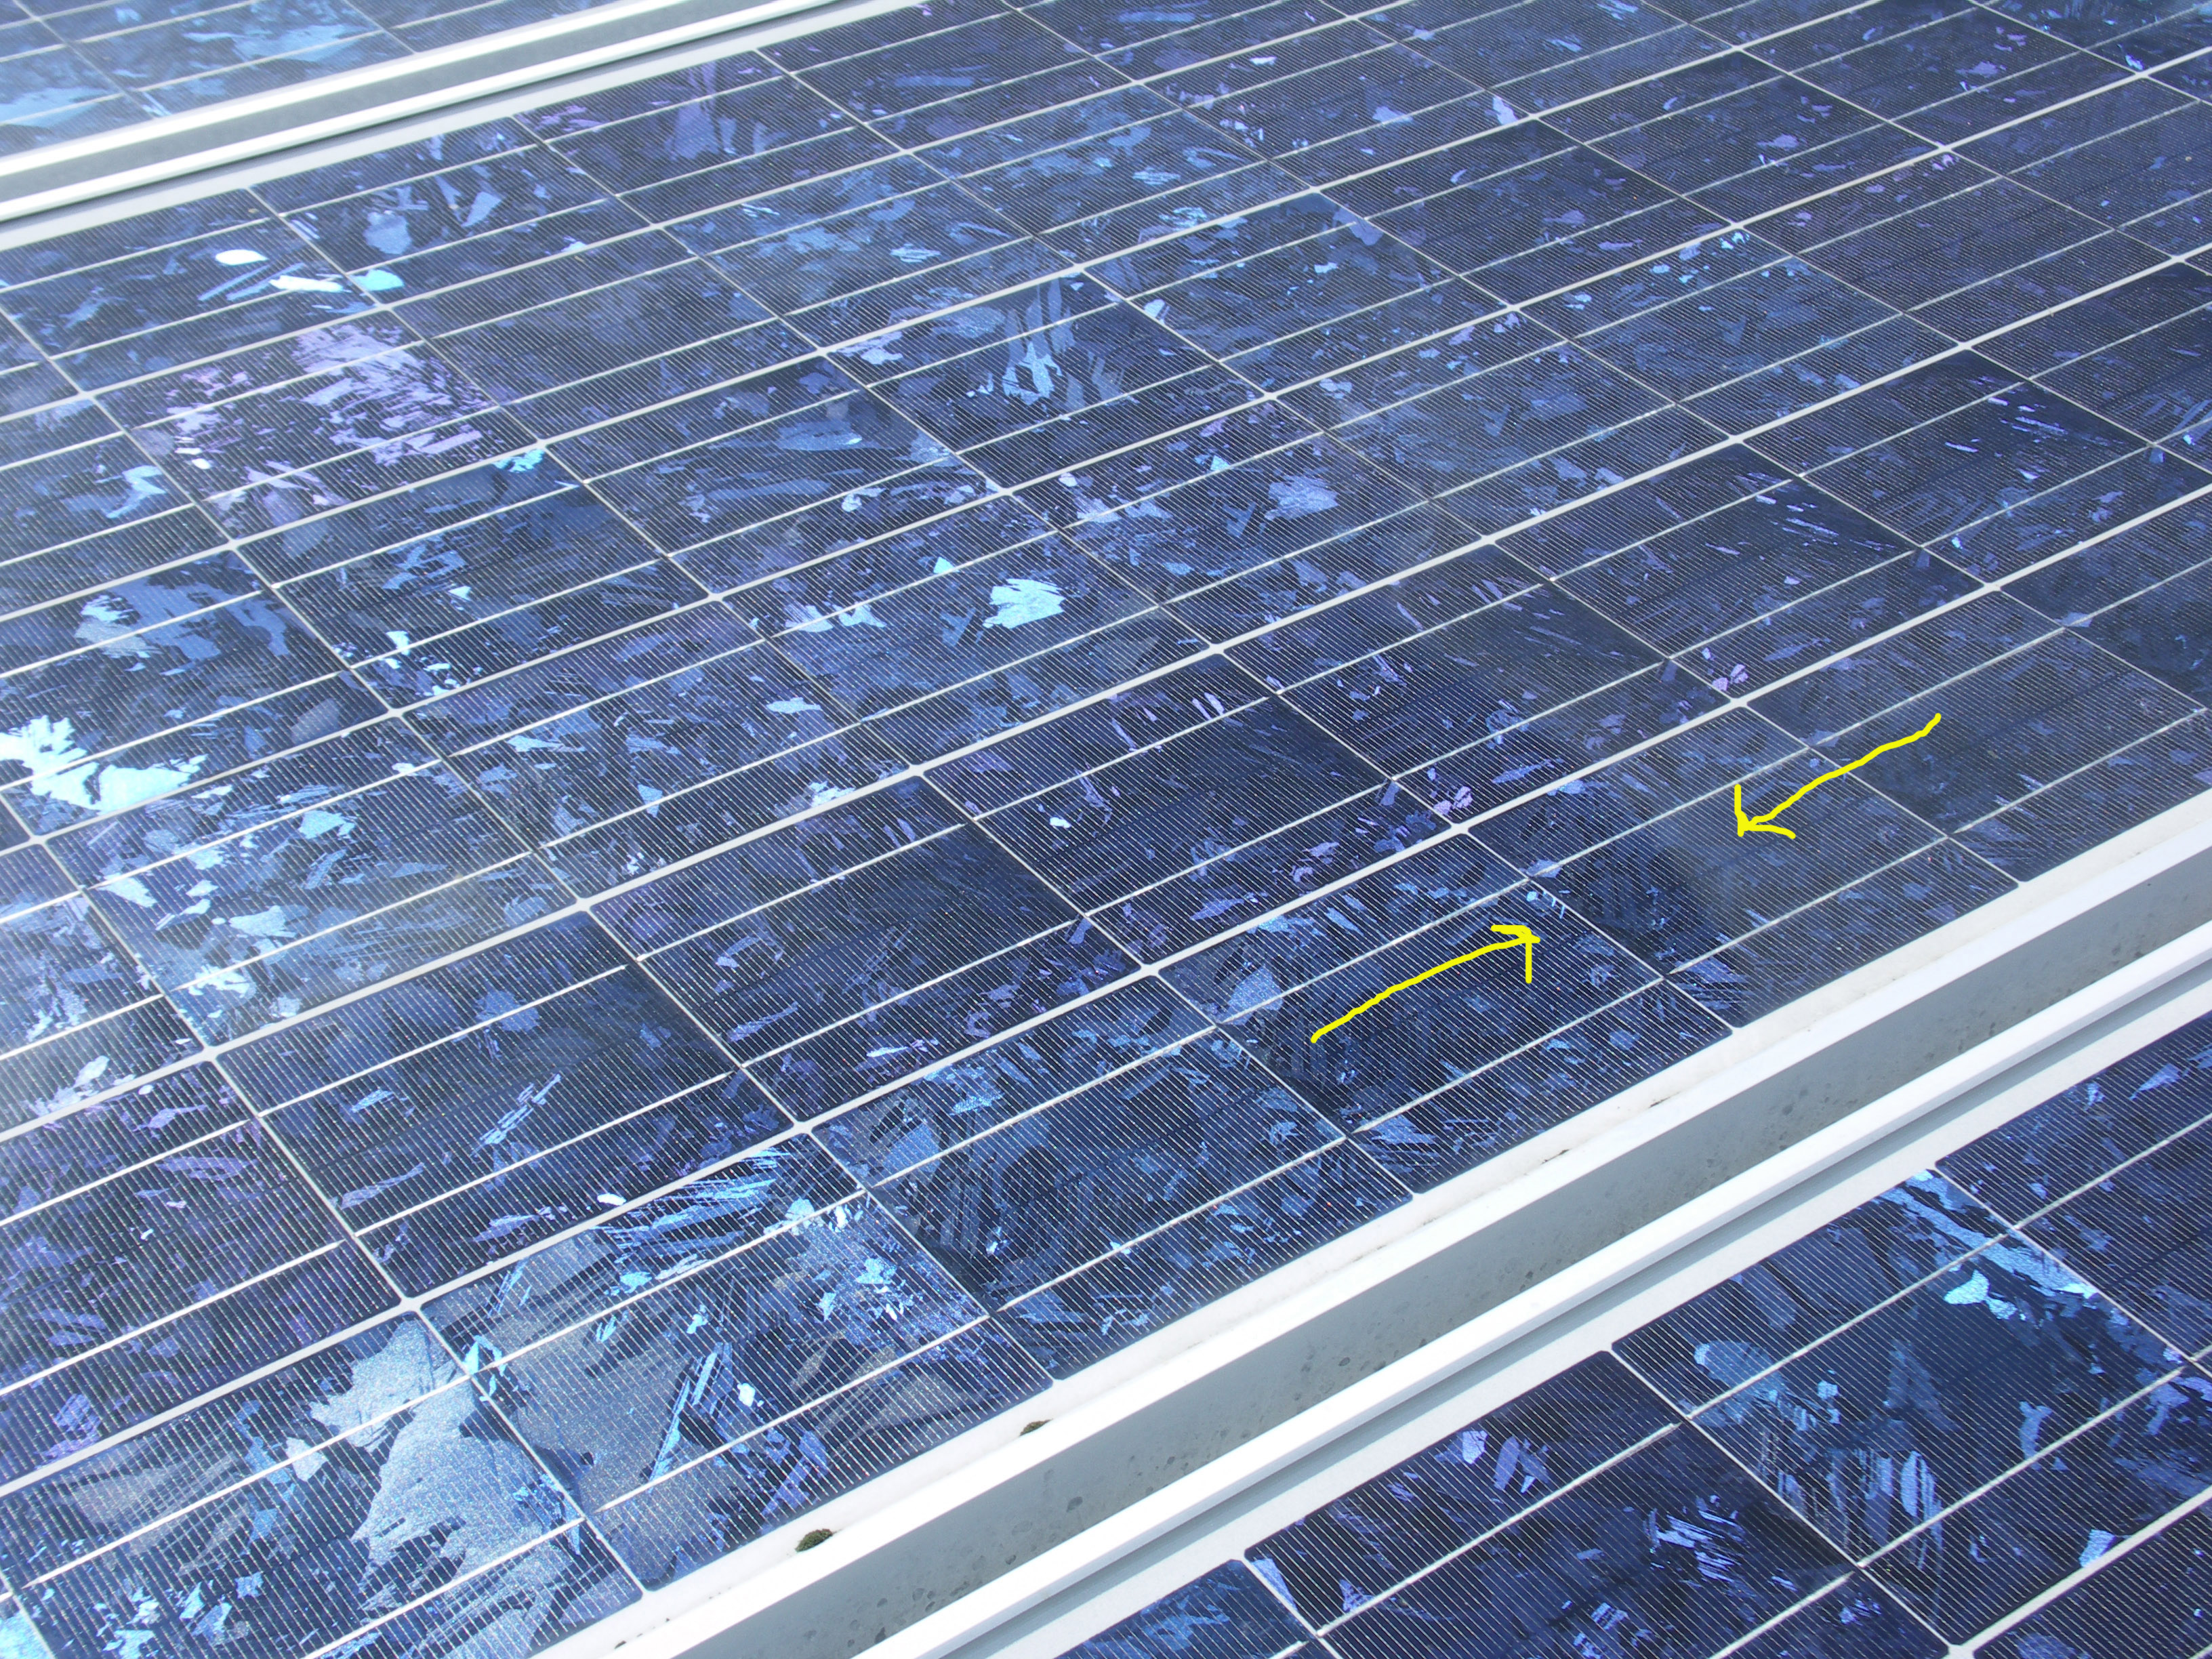
There are other perils, of course. On Independence Day, July 4, there is a proliferation of private
fireworks displays. Rockets with exploding displays are illegal in our community. What goes up
has to come down and this year some residue landed on a panel but evidently it had burned and
cooled. The image on the left is as I found it. The pile of ashes were brushed away (center) and
then cleaned with Windex (right). But notice that after the spot was cleaned with Windex, ten
years of residue appeared at the right, the smudge of which begins between the arrows.
Rate Games
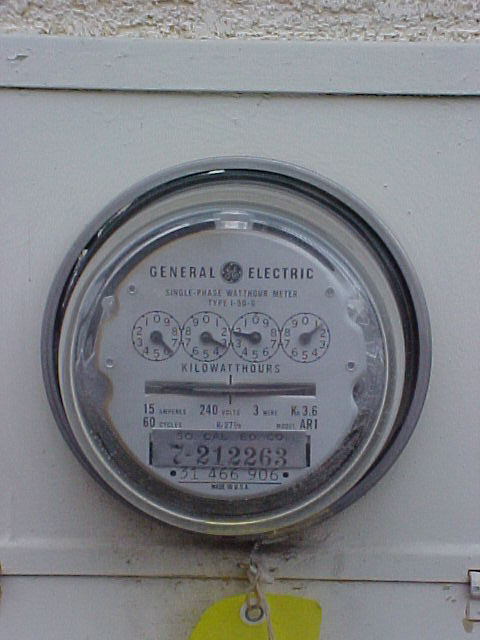 When our system in Lakewood was first installed we were billed at a flat rate and that
rate was close to 13 cents per kilowatt hour. The meter had an old fashioned spinning disk
which reversed direction when the amount of energy generated exceeded that which was
being consumed. We
have since switched to "time of use" or TOU
metering. It turns out that Southern California Edison (Lakewood) has a handful of rate
schedules. TOU-D2 is for big users. TOU-D1 is for regular residential, or small, users.
TOU-D8 is the schedule applied to the electricity use on the university campus where I taught
for many years. Our home in Lakewood is billed on the TOU-D1 schedule.
When our system in Lakewood was first installed we were billed at a flat rate and that
rate was close to 13 cents per kilowatt hour. The meter had an old fashioned spinning disk
which reversed direction when the amount of energy generated exceeded that which was
being consumed. We
have since switched to "time of use" or TOU
metering. It turns out that Southern California Edison (Lakewood) has a handful of rate
schedules. TOU-D2 is for big users. TOU-D1 is for regular residential, or small, users.
TOU-D8 is the schedule applied to the electricity use on the university campus where I taught
for many years. Our home in Lakewood is billed on the TOU-D1 schedule.
TOU-D1 has four rates: two for summer and two for winter. For each they are on-peak and
off-peak. On-peak is higher than off-peak.
| Period |
Cost per
kwh ($ U.S.) |
| Winter On Peak |
0.202 |
| Winter Off Peak |
0.142 |
| Summer On Peak |
0.504 |
| Summer Off Peak |
0.147 |
Note that the winter on-peak rate is about 50% more than the off-peak rate, but that the
summer on-peak rate is about 250% more than the off-peak rate. The high value of the on-
peak rate is not typical. It generally hovers around $0.43 per kilowatt hour or 200% more
than the off-peak rate.
The typical bill has a number of add-ons, such as "Transmission Owners Tariff Charge," the
"Nuclear Decommissioning Charge," the "Public Purpose Programs Charge," the "The Public
Utilities Commission Reimbursement Fee", and the "California Alternate Rates for Energy
Surcharge, where applicable." All of these fees are charged by the kilowatt hour and although
I have been told by a representative of the utility that there is variability from one month to
the next as to which are applied to a specific customer's bill so that even if the customer
wanted to create a private spreadsheet, it would be impossible because the rates change
slightly from month to month owing to which of the above charges apply. On the other hand,
an approximate rate can be determined by using simultaneous equations between pairs of
months in which only one rate "season" was involved: winter or summer. Since on-peak and
off-peak rates are different, one can then calculate each rate for that particular pair of months.
When the crossover between winter and summer occurs, one is faced with four variables:
summer on- and off- and winter on- and off-peak. My approach then is to fudge things by
taking earlier values and then varying things in the spreadsheet until the value established by
the utility matches the result of my equations. It isn't exact, but it is close. The long and the
short of it is that with Time-of-use metering (TOU), our rates vary from one month to the
next regardless of which utility is providing the service. If you pay a flat rate you still have to
pay the squishy add-ons, listed above.
Net Metering
Get a check from the electric company?
 Here are two histograms, one for August 21, 2012 on the left and one for April 24, 2015 on
the right from Southern California Edison in Lakewood. The negative direction represents
net generation and the positive direction net consumption. The red columns are at on-peak
times and the green columns at off-peak times.
Look carefully and tell me the difference between the two. Do you see that the on-peak times
are not the same? Starting in January, 2011, in California, people who generate excess
electricity are allowed
to sell it to their electric utility. That is, for the first time in history, the tops of our roofs
began to have profit potential, but a customer must have both a $ credit at the end of the year
and have generated more kilowatt hours than were consumed to get a check from the electric
company. Moreover, since the advantages of rebates and tax credits are forsaken if an
installation greatly exceeds one's need for electricity, very few customers will ever see a
check at
the end of the year because there is no incentive for the customer to load up a roof with
unneeded solar panels. Still, a customer might decide forego the rebates and tax credits to
install far more panels than are needed.
Here are two histograms, one for August 21, 2012 on the left and one for April 24, 2015 on
the right from Southern California Edison in Lakewood. The negative direction represents
net generation and the positive direction net consumption. The red columns are at on-peak
times and the green columns at off-peak times.
Look carefully and tell me the difference between the two. Do you see that the on-peak times
are not the same? Starting in January, 2011, in California, people who generate excess
electricity are allowed
to sell it to their electric utility. That is, for the first time in history, the tops of our roofs
began to have profit potential, but a customer must have both a $ credit at the end of the year
and have generated more kilowatt hours than were consumed to get a check from the electric
company. Moreover, since the advantages of rebates and tax credits are forsaken if an
installation greatly exceeds one's need for electricity, very few customers will ever see a
check at
the end of the year because there is no incentive for the customer to load up a roof with
unneeded solar panels. Still, a customer might decide forego the rebates and tax credits to
install far more panels than are needed.
| Year |
kwH consumed |
kwH generated |
SCE bill |
|
|
|
| 2000 |
7926 |
| 2005-2006 |
3053 |
-2818 |
-$107.19 |
| 2006-2007 |
3257 |
-2945 |
-$134.00 |
| 2007-2008 |
3409 |
-3048 |
-$68.06 |
| 2008-2009 |
3445 |
-2915 |
-$22.22 |
| 2009-2010 |
3235 |
-2993 |
-$64.20 |
| 2010-2011 |
2553 |
-2782 |
-$198.79 |
| 2011-2012 |
3060 |
-2760 |
-$29.63 |
| 2012-2013 |
3490 |
-3005 |
-$48.17 |
| 2013-2014 |
3474 |
-2881 |
$73.85 |
| 2014-2015 |
3774 |
-2732 |
$124.60 |
| 2015-2016 |
3878 |
-2683 |
$187.68 |
| 2016-2017 |
3274 |
-2722 |
$15.51 |
2017-2018 |
3651 |
-2558 |
$139.89 |
The amount which a customer gets from the utility for excess electricity generated is called
the feed-in tariff which turns out to be, in California, an amount right around the wholesale
rate for electricity. On the one hand, the feed-in tariff, which is a schedule regulated by the
Public Utilities Commission, requires the utility to credit the customer (not to write him a
check) for excess electricity at the rate charged for consumption at that time.
That is, one kilowatt hour of consumed electricity is worth the same amount as
one kilowatt hour of generated electricity, on-peak or off-peak, summer or winter. On the
other hand, one does not get a check from the utility unless the total generation of energy
exceeds the total consumption. The table above shows that even though eight years out of the
10 I ran up a $ credit with the utility, only during one, 2010-2011, did I generate more
electricity than I consumed and the check at the end of that fiscal year was $8.42, amounting
to 3.7 cents per kilowatt hour, so the on-peak rates which we pay may be as high as $0.50 per
kilowatt hour and as low as $0.13 per kilowatt hour, but if you get a check from your utility, it
will be at the wholesale rate. Before we go on, notice in the table that every year from 2005
to 2013 we had a $ credit, but no check was received until the total generation exceeded the
total consumption. Note that even though I had a credit of $198.79 during 2010-2011, the
check I received was $8.42, calculated at the wholesale rate for the net energy generated.
Note also, that the first year we had to pay a utility bill was the year that on-peak times were
changed. Finally, note that in 2000, about three years before we made the decision to install
solar panels we consumed 7926 kilowatt hours of energy. Over the next three years we
converted to compact fluorescent lights which brought our consumption down to around 6600
kilowatt hours, not nearly enough to break even after the panels were installed. What
happened? We bought the vacation home near Yosemite and ended up staying in both about
50% of the time. The original estimate for my needs in sustainable energy was off by around
3600 kilowatt hours or more than 50%. Why? Presumably because I underestimated the
number of cloudy days in a year and overestimated the energy available when the sun is low
in the sky but our 50% occupancy pretty well took care of the problem. In any case, there's
no match for real data, and a good relationship to remember is that the number of watts of
rated power ends up being close to the annual
kilowatt hours of generated electricity. The two numbers are coincidentally close to each
other but may be off by 10-20%. Those numbers are in any case a good place to start. For
any critic who complains (correctly) that watts are not the same as kilowatt hours, your
answer ought to be, "No, but the two numbers are coincidentally close to each other and
therefore easy to remember." A different location and a different slant will produce a
different result. A friend in the greater Lakewood area asked me to estimate how many
panels he would need with an annual consumption of 10,000 kilowatt hours. With the same
tilt that I have, for 10,000 kwh, in order to break even he would need 10 rated kw, or 10,000
watts of panels. At a rated power output of 165 watts per panel, he'd need 10000/165 = 61
panels. At a rated power output of 245 watts per panel, he'd need 10000/245 = 41
panels.
In 2008-2009 we consumed 3445 kwH and generated 2915 kwH energy. An estimate of the
number of panels needed to bring our generation up to the level of consumption for that 12-
month period would be (3445-2915)/3445 x 18 = 2.77, or 3 panels. Although our credit would
balloon up to around the level we enjoyed in 2010-2011 there would be no monetary advantage
of doing so if our generated energy remained below that of our consumed energy. That is, there
would be no check from the utility.
When you finally make the big decision, a jolly young technician will arrive with a hand held
computer containing an appropriate app and will walk around on your property to figure the
best place to put the panels. When that happened to us in the Yosemite cabin, I didn't tell the
technician that we occupied the place only 50% of the time. His app told him to install 5kw
of panels which ended up producing (for the first full year) 6000 kilowatt hours of energy.
But that was what he would have recommended assuming 100% occupancy! At 50%
occupancy it has worked out just fine, but beware! Have the numbers in front of you and tell
the jolly technician that you'll need your estimated number of panels to break even.
How many panels do you REALLY need?
Do you want to generate 50% of the energy you consume? 100%? Would you be satisfied to
reach a $ break-even point with fewer panels but by taking advantage of the rate differences
offered by net metering?
One would expect that if one panel with a particular power rating in watts in one orientation
generates x kilowatt hours of energy over one year, then two panels each having the same power
rating as the first and mounted in the same orientation adjacent to each other will generate 2x
kilowatt hours
of energy over one year. Such an assumption allows us to apply a ratio of kilowatt hours of
energy generated annually divided by the total rated watts of the panels. With the understanding
that some installations are
going to collect the sun's energy more effectively than others, the ratio gives us a range of
expectations, but the data are real and offer a spectrum of what one might expect from one's own
installation.
The three entries from Morristown, Tennessee, Madison, Wisconsin and Redding, California
were contributed by a representative of Enphase after I expressed skepticism over other high
values contributed by members of a solar energy discussion group.
Notwithstanding all of the
possible disadvantages posed by privately owned rooftop systems such as shading by trees and
other structures and bad placement and tilting, these ratios, from 0.97 to 1.71 offer good food for
thought for intended owners of rooftop and other PV installations. I would add that the values of
0.97 and the one following that, 1.32, are panels on the roof of the same dwelling, the first with a
compound tilt toward the south but mounted on an east-facing roof; the second panels are
mounted flat on a west facing roof. Moreover, there are 5 panels without shading, but four are
shaded by a chimney part of each day (see photo below). Yet, the second set has a B/A ratio (see
table below) of 1.32, whereas the first has B/A=0.97. Why the difference? Possibly morning
coastal fog for the location which diminishes the output of the panels on the east side..
Here are the data:
| Rated Watts (A) |
Annual kwh generated (B) |
Details |
Location |
B/A |
Comments |
| 5145 |
6090 |
Av. for 2013, 2014 |
Oakhurst, Calif. |
1.18 |
Less than ideal tilt |
| 2970 (18 x 165w) |
2888 |
10-yr. average |
Lakewood, Calif. |
0.97 |
Compound tilt on east-facing roof |
| 2835 (9 x 315w) |
3751 (2020,2021 av) |
annual average |
Lakewood, Calif. |
1.32 |
Flat on west-facing roof |
| 4600 |
6345 |
3-yr. av. |
Tennessee |
1.38 |
Ground mounted, ideal tilt. |
| 7500 |
8570 |
3-yr. av. |
Michigan |
1.14 |
N.A. |
| 5280 |
5842 |
2-yr. av. |
Tacoma, WA |
1.11 |
N.A. |
| 2250 |
3400 |
7-yr. av. |
Northern California, 37 deg. north. |
1.51 |
N.A. |
| 22560 |
26524 |
3-yr. av. |
Central Illinois |
1.18 |
N.A. |
| 1125 |
1570 |
5-yr. av. |
SW Wisconsin |
1.40 |
N.A. |
| 6500 |
9230 |
Jan 1, 2015 - Jan 1, 2016 |
Morristown, Tennessee |
1.42 |
Azimuth 180 deg., reported |
| 8400 |
9500 |
Jan 1, 2015 - Jan 1, 2016 |
Madison, Wisconsin |
1.13 |
Azimuth 180 deg., reported |
| 7500 |
12800 |
Jan 1, 2015 - Jan 1, 2016 |
Redding, Calif. |
1.71 |
Azimuth 180 deg., reported |
| 2000 |
2084 |
1 year |
High Littleton near Bristol, UK. |
1.042 |
Due south, 40 deg. elevation |
| 14850 |
16199 |
Aug 1, 2015 - July 31, 2016 |
Oakhurst, Calif. |
1.091 |
Azimuth 170 deg., reported; shade trees east and west. |
| 2760 |
4566 |
Annual average over seven years |
Long Beach, Calif. |
1.65 |
No shade, due south, ideal tilt |
| 3660 |
5962 |
One year output |
Carlsbad, Calif. |
1.63 |
Azimuth 255 deg., ideal tilt |
| 6110 |
9148 |
One year output |
Mar Vista, Calif. |
1.50 |
Azimuth 180 deg., ideal tilt |
| 9100 |
11700 |
Four year average |
Bitterroot Valley, Montana |
1.29 |
Latitude 46.0 deg N, array facing 152 deg (SSE) |
| 3375 |
5498 |
One year output |
Pleasanton, Calif. |
1.62 |
Latitude 37.4 deg N, array facing 160 deg (SSE) |
Without putting too fine a point on it, for starters one could
estimate, based on real data, the number of rated watts needed to produce an annual quantity of
energy in kilowatt hours with the simple equation
(Rated Watts) = (Annual energy to be generated in kilowatt hours)/(B/A)
An appropriate value of (B/A) could be taken from one of the values deemed to be appropriate in
this table, or calculated from a known installation similar to that which is desired.
Out-of-pocket costs for your panels.
For what it's worth, I have three numbers for $ per rated watt for our first and second
installations and one for a future installation now being planned. Here they are:
Installation 1, 2004: 18 165-watt panels, $13175 after State of California tax credit and rebate.
That comes to 13175/(18x165)=$4.44 per rated watt.
Installation 2, 2014: 21 245-watt panels, $15304 after State of California tax credit (no more
rebates). That comes to 15304/(21x245) = $2.97 per rated watt.
Installation 3, 2018: 9 315-watt panels, $8990 after State of California tax credit.
That comes to 8990/(9x315) = $3.17 per rated watt.
If you are advising a group responsible for management of a large
organization, there is always the possibility of "slippage" where good, hard judgment on the part
of board members is needed. A board member of a local church asked me to take a look at a
proposal received by a solar panel installer. The bottom line: The cash purchase price of
$172,159 (including all applicable credits and discounts) for a system of 28,100 rated watts
comes out to $172,159/28,100 = $6.13 per watt. So the advice I gave them was that the price
was high and that they must get competitive bids on the
purchase.
More Panels?
In the United States there are around 3,300 electric utilities of which approximately 200 supply a
majority of citizens their electrical energy; the rules governing the generation of solar energy can
vary considerably from one state to the next. In California the utilities enforce the "120% Rule".
Until I decided to put in a second set of panels at the location of the first installation, I thought
erroneously that the "120% Rule" limited one's energy generation to 120% of one's energy
consumption. Most amusingly, not so. The 120% Rule is a safety regulation set up so that one
does not overload the busbar of the main circuit breaker panel. A busbar rated at 100 amperes
with the main circuit breaker at the top and allowing current to pass into the bus from the grid at
that point can, according to the rule, accommodate solar energy sources which generate up to
20% of the rated capacity, the current from which then passes into the busbar at the bottom
through separate circuit
breakers. So the worry that I would be denied an installation of the second set of panels turned
out to be groundless. On the other hand, the new installation may be judged just to exceed
that which is allowed under the 120% rule, even though my projection to the summer solstice
predicts 18.64 amperes at maximum output. If I'm unable to make my case, either I will have to
upgrade the
circuit breaker panel at an estimated cost of $2,200 or do a "side tap" which would be to
connect the new installation, through a separate circuit breaker, directly to the meter at
an estimated cost of $600. Most unfortunately, the interpretation of the "120% rule" varies by
jurisdiction, utility and State, so it isn't at all clear that my case for no upgrade will be approved.
San Diego, for example, interprets the "120% rule" as follows: Add up the current rating of all
inverters feeding the grid, then multiply by 1.25. That value becomes the 20% beyond which
one's circuit breaker panel is rated. I may be accurate about my system not exceeding 20
measured amperes, but the foregoing calculation leads to a value of just over 30 amperes, which
would demand a circuit breaker panel of at least 150 amperes. A decision has yet to be made on
my case for no upgrade.
Companies which install solar panels don't want to fool around with installations of three panels
or so, just what I needed to pass through the gap between $ break-even and energy (kwh) break
even, but they were ready, willing and able to install nine panels for me! So, among the options I
will have producing considerably more energy than I consume will be each year to receive a
check after the completion of the annual true-up cycle, albeit at the wholesale rate of around 3.7
cents per kwh. For a period of about 7 years after the first installation I showed a $ credit, though
my consumption of energy was greater than the generation of energy, but the $ credit was based
on the "on-peak" rate when consumption was generally less than generation. But in 2011, the
on-peak period was changed from 10am-6pm to 11am-6pm which put me just below the $ break-
even point. Looking toward the future when the on-peak rate may change even further, I decided
to install a sufficient number of panels to arrive at a kwh break-even. The new installation, with
nine panels, has six more than would be needed to reach kwh break-even. In addition to
receiving a check at the wholesale rate there are some other possibilities which may prove to be
even more advantageous. Watch this space!
How about the loss of output over the years?
One hears the value of 0.5% per year bandied about. That is, for each year in operation the
output of energy of solar panels diminishes by 0.5%. How close is that to reality?
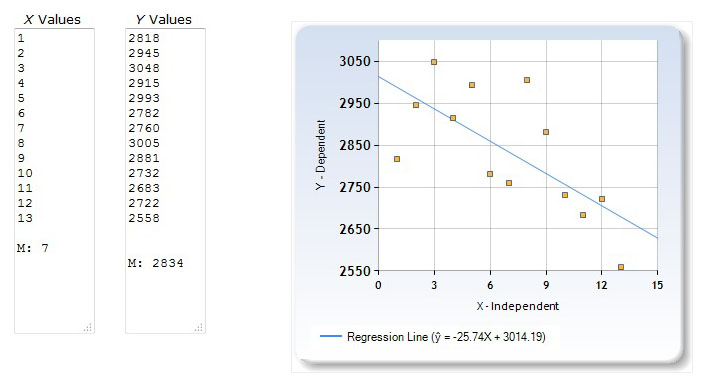
The first installation described here has now operated for over 13 years. The data showing
annual generation of energy are given in kilowatt hours in the table above, showing the full years
from 2005-2006 to 2017-2018. Using a regression line calculator on the web, we get the trend
shown in the figure:
Note that just glancing at the data points, dispersed though they are, one can see a very definite
downward trend. Thirteen dispersed points don't make a lot of sense to produce a regression line
which offers much confidence, but it's the only thing we have, so the equation comes out to be
y= -25.74x + 3014.19, so at year zero, y=3014.19 kwh and at year 15,
y= -25.74*15+3014.19=2628.09 kwh, a loss of 3014.19-2628.09=386.1 kwh, or a percentage
drop of 386.1/3014.19*100=12.8%. The percentage drop per year would then be
12.8/15=0.85%. Considering that the 0.5% figure probably is a representation of the aging of
clean panels, the 0.85% per year drop in energy output is not surprising if one takes into account
the buildup of dust layers month by month and periodic rinsing of dirty panels. The figure is in
the right ball park in any case, in my opinion.
The Down Side of Photovoltaic Panels on Your Roof
You're the owner of your own private utility, for better or for worse. Most people won't be
interested in assuming that role, just as most people aren't interested in being ham radio
operators, hang glider pilots or deep sea divers. As an owner of your own private utility,
it is
your job to keep it operating, so you have to have a system which will give you a "heads up"
when things go wrong.
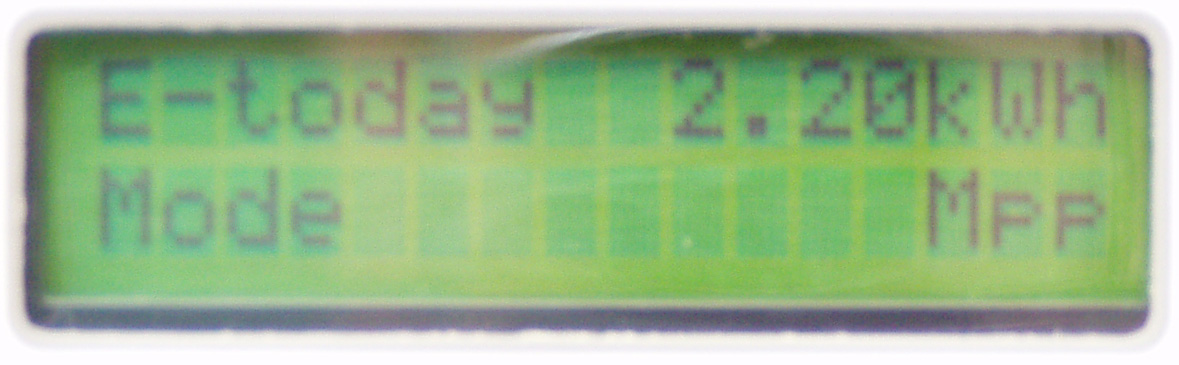
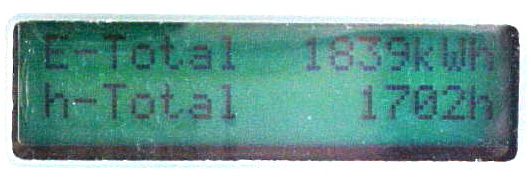
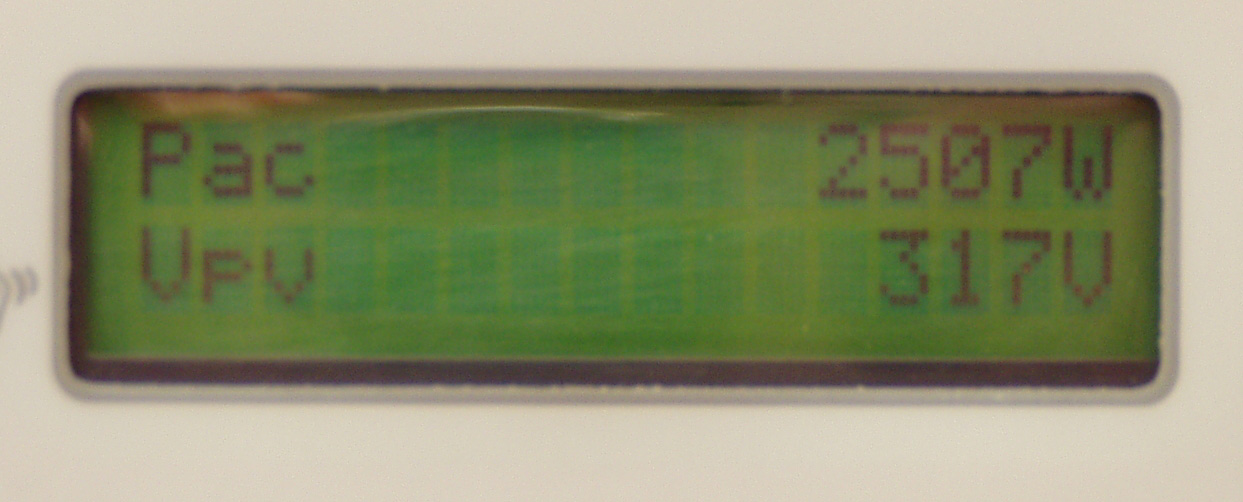 In the beginning, our system had a window in the inverter which showed the alternating
current power being produced during the day (left). That meant that in order to make sure
everything was operating properly, I had to go outside and look at the readout in the window.
A push of a button cycled between kilowatts of power, voltage, daily energy, total energy and
total hours of operation. One day, with no discernable motive, I took a look and saw a blank
readout (right).
In the beginning, our system had a window in the inverter which showed the alternating
current power being produced during the day (left). That meant that in order to make sure
everything was operating properly, I had to go outside and look at the readout in the window.
A push of a button cycled between kilowatts of power, voltage, daily energy, total energy and
total hours of operation. One day, with no discernable motive, I took a look and saw a blank
readout (right).
Suddenly one's attitude changes abruptly. You are the CEO of your private utility and when
your panels don't work, that means money out of your pocket. While waiting for the
repairman to arrive,
 I took a look in the junction box where the wires from the panels connect to the
wire
which leads to the inverter.
The removal of the inspection plate and a brief investigation revealed the damage you see
here.
The plastic shield of the twist connector had melted, leaving the conical compression
connector
which holds the wires together. The single red wire leading out of the connector to the
inverter
had melted close to its entrance in the connector. The twisted wires had evidently slowly
corroded, the resistance went up, heat was generated and finally the single wire to the inverter
melted. The problem was corrected after about three days.
I took a look in the junction box where the wires from the panels connect to the
wire
which leads to the inverter.
The removal of the inspection plate and a brief investigation revealed the damage you see
here.
The plastic shield of the twist connector had melted, leaving the conical compression
connector
which holds the wires together. The single red wire leading out of the connector to the
inverter
had melted close to its entrance in the connector. The twisted wires had evidently slowly
corroded, the resistance went up, heat was generated and finally the single wire to the inverter
melted. The problem was corrected after about three days.
Fortunately, an upgrade by the manufacturer uses bluetooth to transmit the panels' generation
from the inverter into the house where it sits in my study.
Solar Silliness
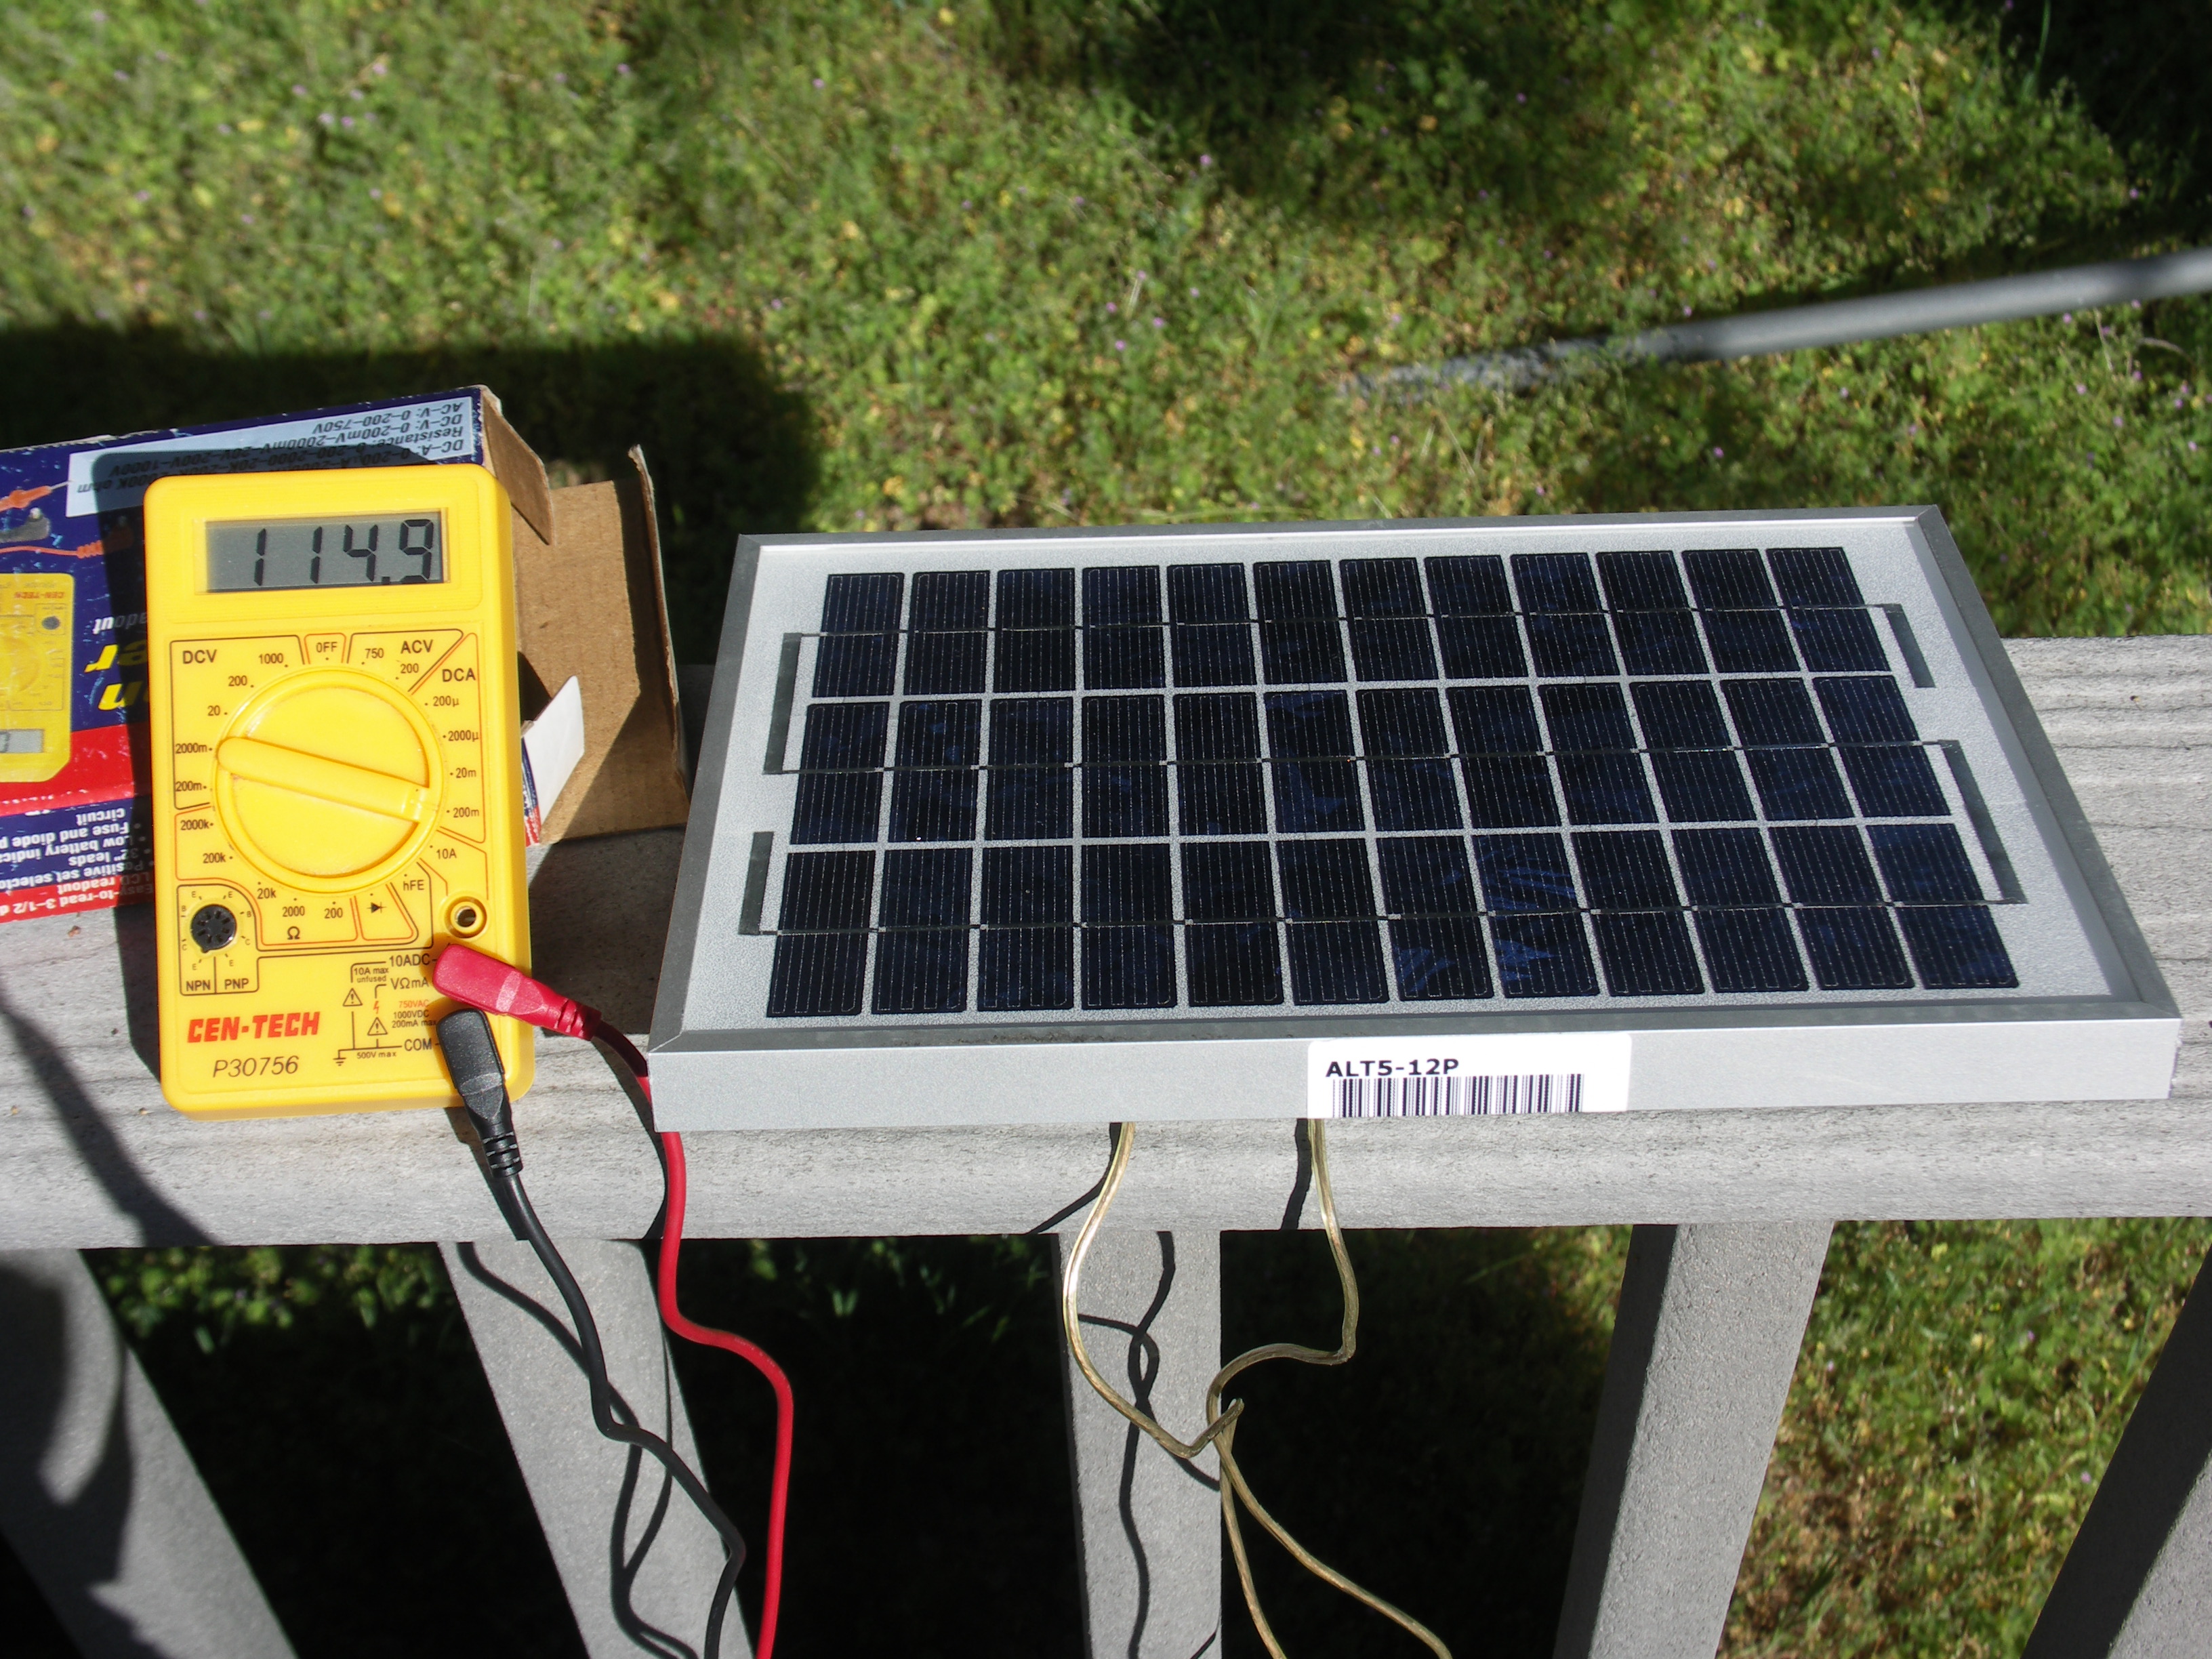
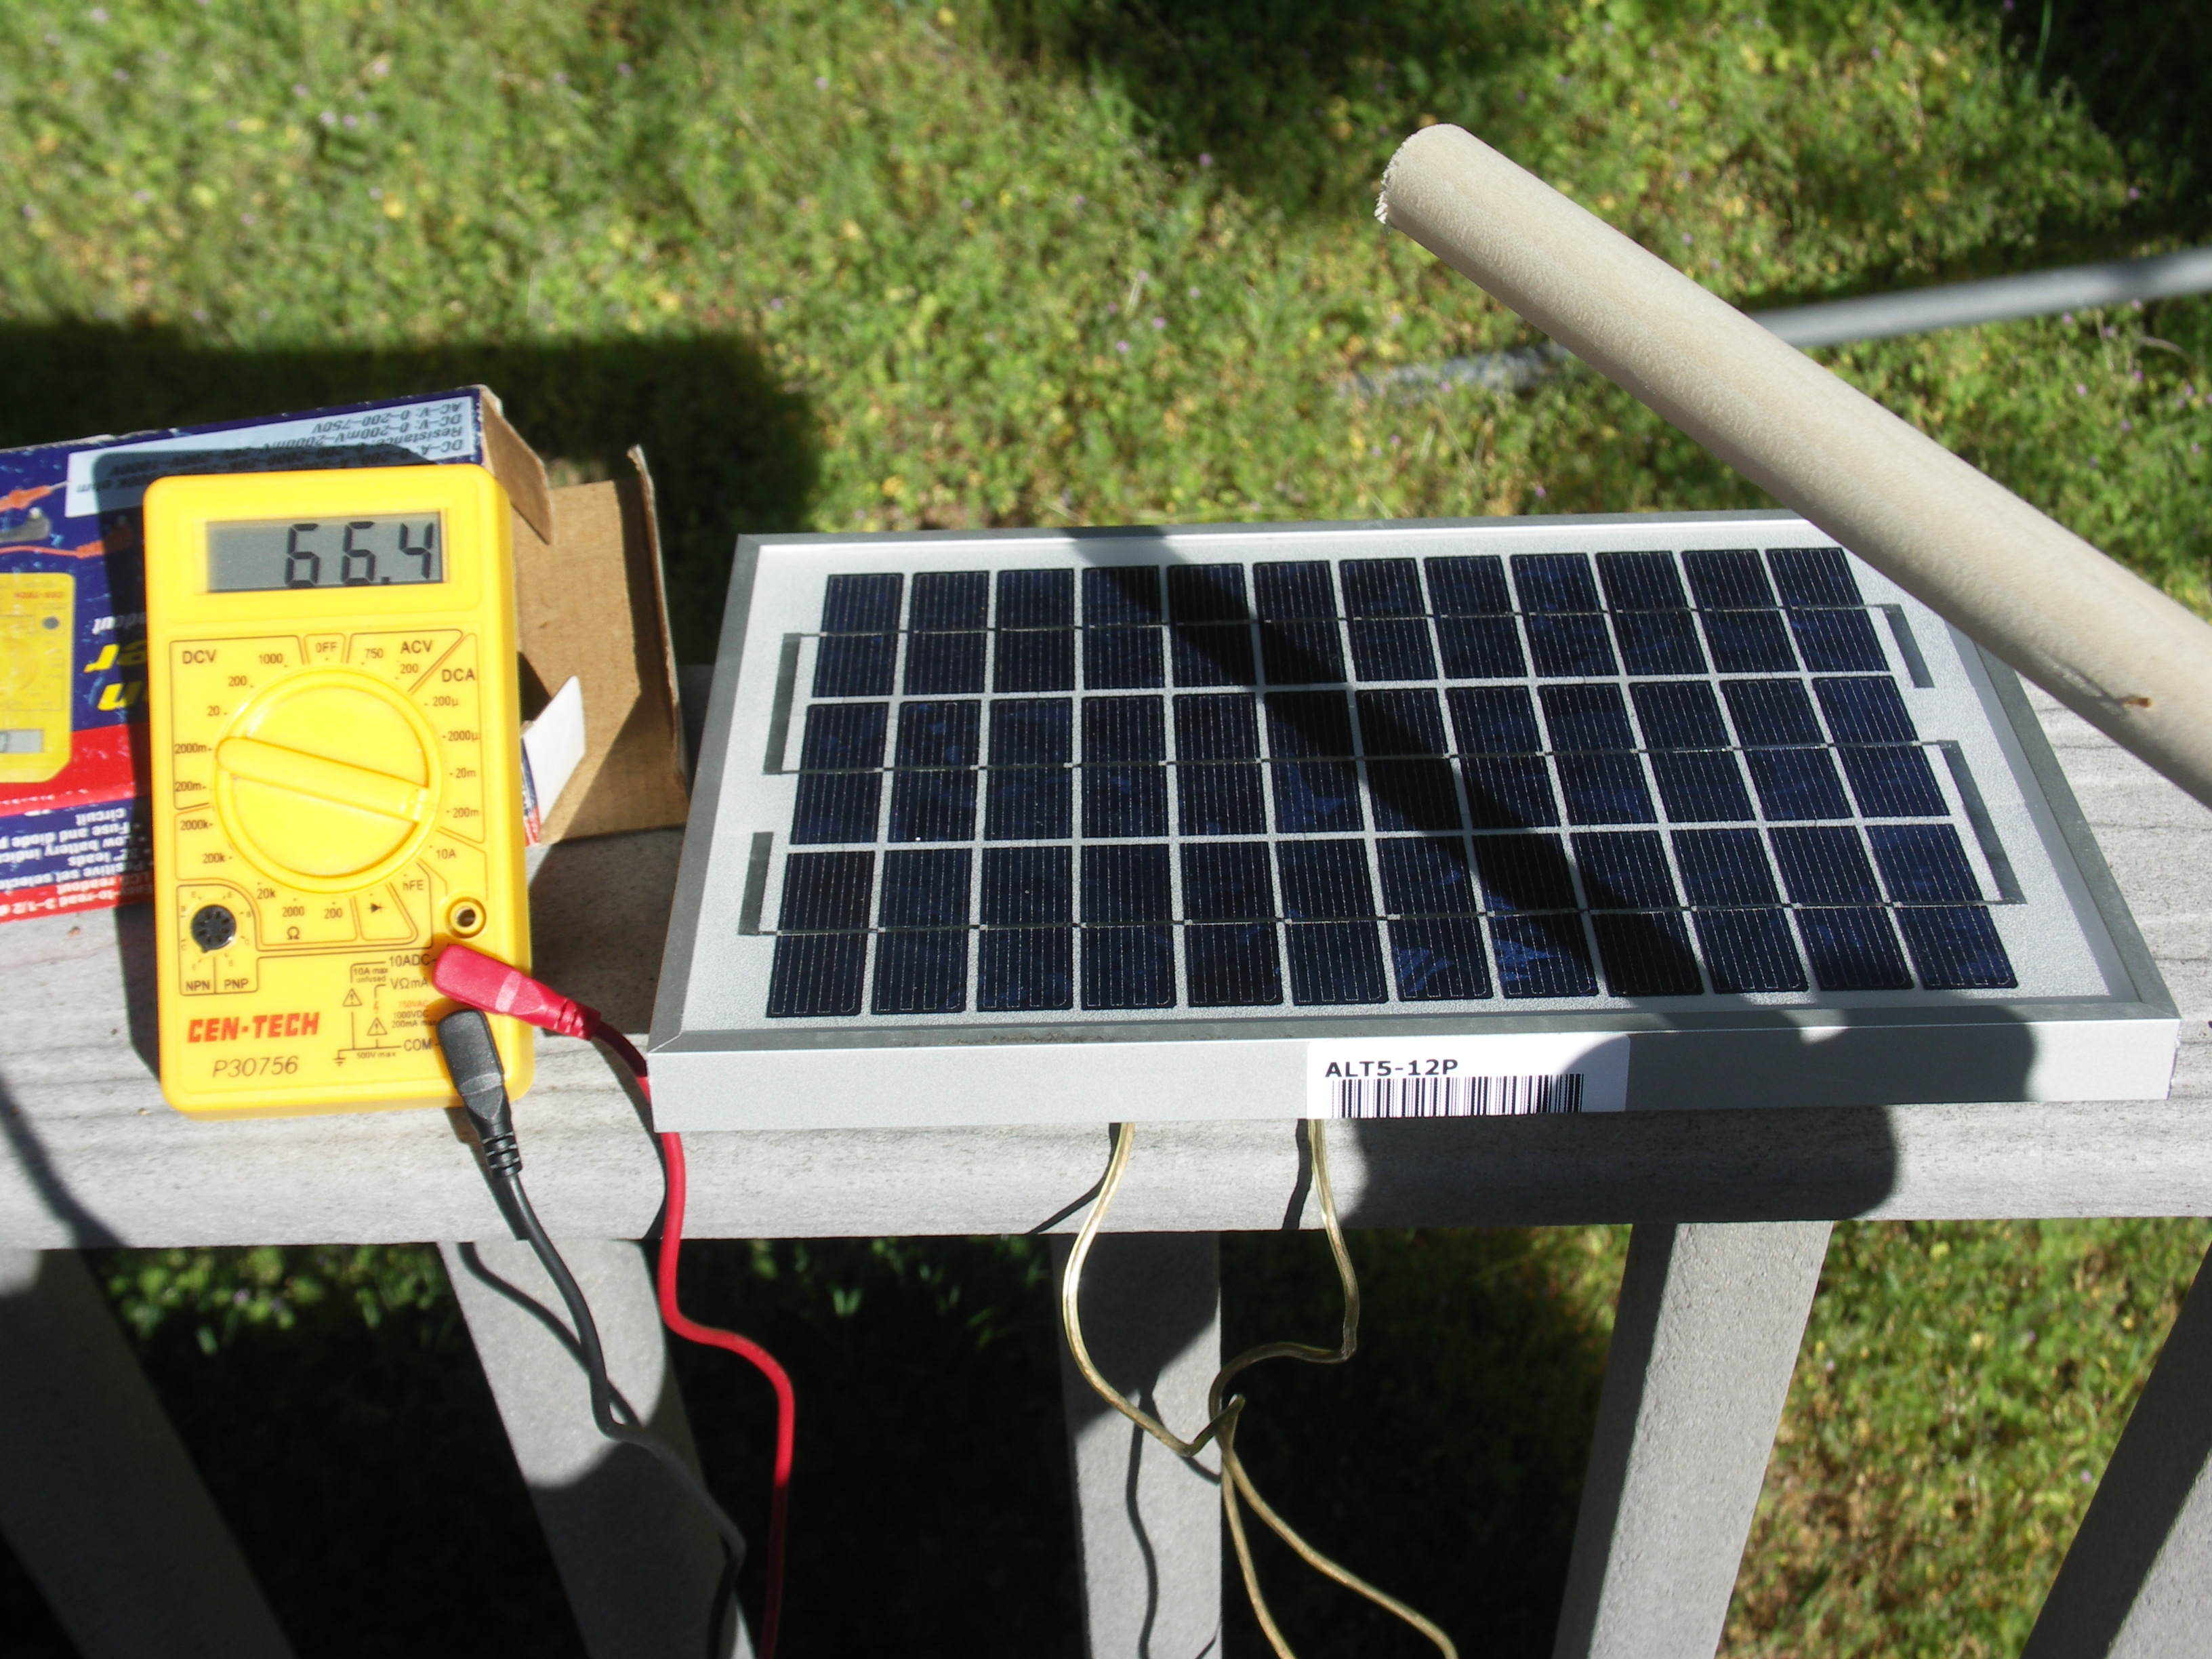 It isn't difficult to see installations of PV panels with problems. Sometimes people step into
it innocently owing to lack of experience. Others look at a spread sheet detailing expense and
make bad decisions. Take shading as an example. At the left and right one sees a panel fully
exposed to sunlight (left) and then with the shade of a wooden dowel falling diagonally across
the panel (right). Look at the change in current for that small dowel!
It isn't difficult to see installations of PV panels with problems. Sometimes people step into
it innocently owing to lack of experience. Others look at a spread sheet detailing expense and
make bad decisions. Take shading as an example. At the left and right one sees a panel fully
exposed to sunlight (left) and then with the shade of a wooden dowel falling diagonally across
the panel (right). Look at the change in current for that small dowel!
When we installed the panels on our house roof I had the expectation that we could allow
them to
sit there without a worry or care and to
generate electricity during daylight hours for the next twenty-five years when the guarantee
runs
out.
That they ought to be exposed to unshaded sunlight was obvious, but my early discovery that
in
order to achieve maximum output they need also to be rinsed periodically was an early lesson
in
the maintenance of solar panels. I have been more recently surprised that these two points are
not
fully appreciated by everyone, not even some "experts."
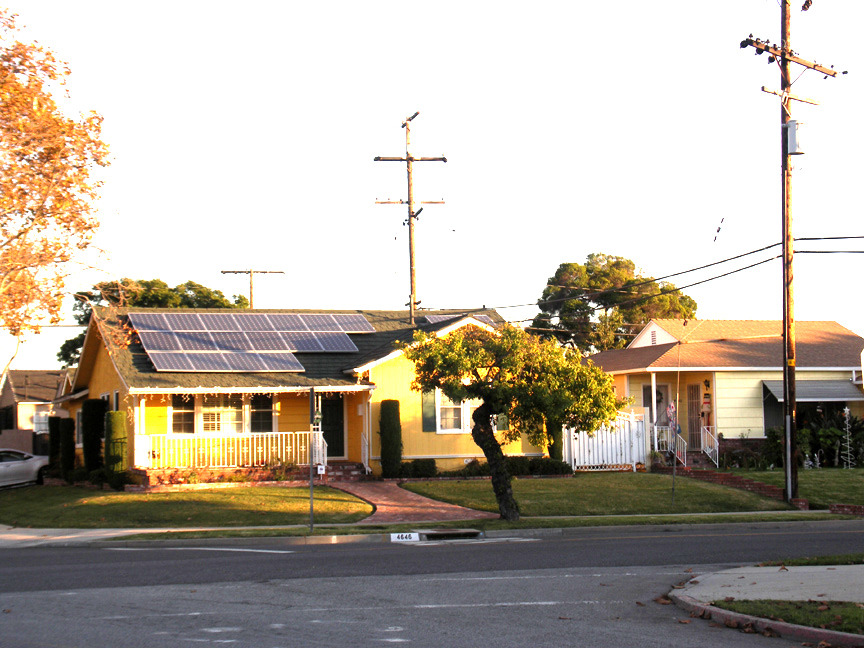 Here's a house in our neighborhood with panels mounted in a manner which are shaded by a
nearby telephone pole during a part of each day when the sun is low in the sky.
Here's a house in our neighborhood with panels mounted in a manner which are shaded by a
nearby telephone pole during a part of each day when the sun is low in the sky.
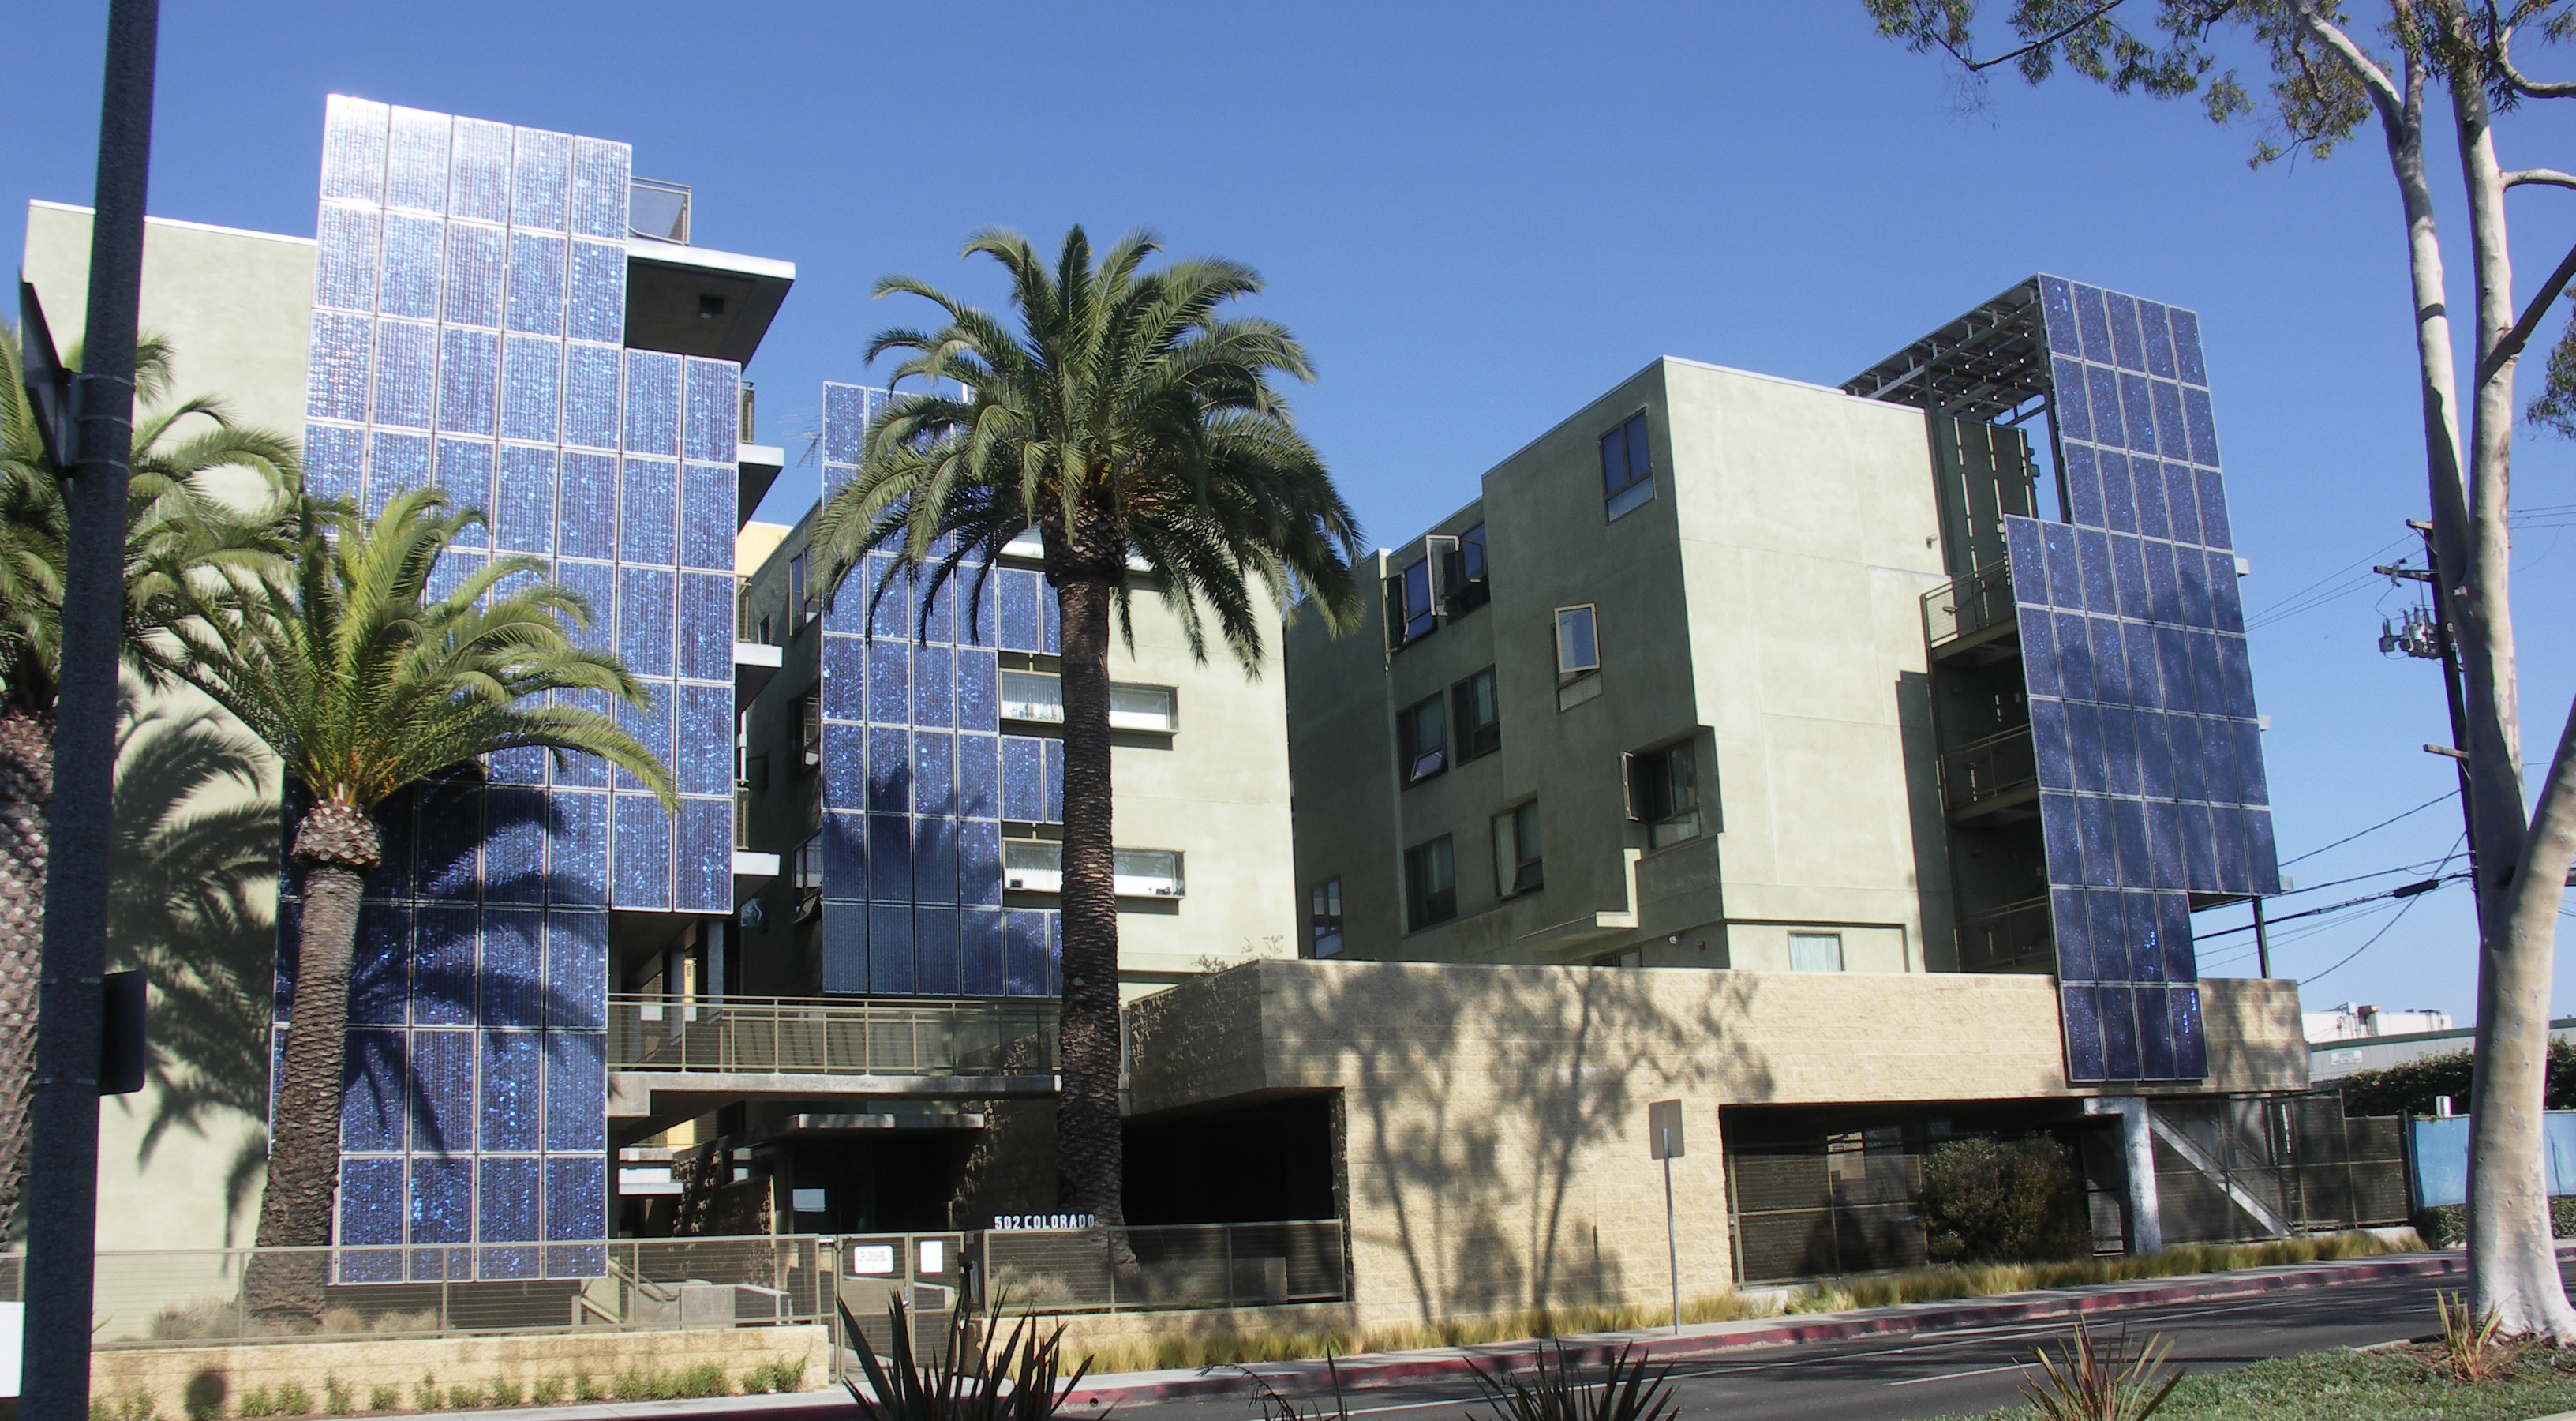
 As more people install PV systems it stands to reason that some will make informed choices
and
others will not. It is with more than a little amusement then that one can find some rather
large
but ill-conceived installations carried out by people one would think should know better.
Here is
an ambitious private installation of approximately 35 kW on an apartment house in Santa
Monica,
California,
consisting of both vertically and horizontally mounted panels. The vertical panels face
southwest
and do not receive direct sunlight until late each morning. Moreover, neither the vertical
panels
nor the horizontal panels at the right are tilted toward the south at the angle of latitude. The
shadows cast by the 3 palm trees and the eucalyptus tree (right) for the better part of
the day almost certainly will have an attenuating effect on the energy output; how much
would be
a function of the internal series/parallel circuitry but could be determined with a simulated
equivalent unshaded system.
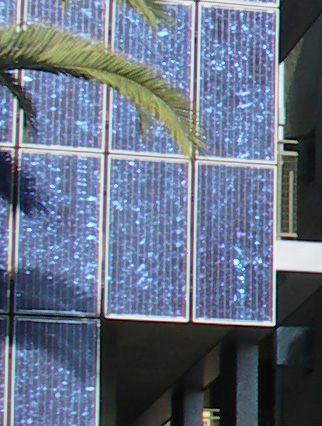
There does seem to be a cleaning schedule in place judging from the blue crystalline
appearance
of the panels' surfaces, at left.
As more people install PV systems it stands to reason that some will make informed choices
and
others will not. It is with more than a little amusement then that one can find some rather
large
but ill-conceived installations carried out by people one would think should know better.
Here is
an ambitious private installation of approximately 35 kW on an apartment house in Santa
Monica,
California,
consisting of both vertically and horizontally mounted panels. The vertical panels face
southwest
and do not receive direct sunlight until late each morning. Moreover, neither the vertical
panels
nor the horizontal panels at the right are tilted toward the south at the angle of latitude. The
shadows cast by the 3 palm trees and the eucalyptus tree (right) for the better part of
the day almost certainly will have an attenuating effect on the energy output; how much
would be
a function of the internal series/parallel circuitry but could be determined with a simulated
equivalent unshaded system.
There does seem to be a cleaning schedule in place judging from the blue crystalline
appearance
of the panels' surfaces, at left.
 The shading of one's solar panels by a neighbor's trees can rise to a litigious level if one lives
in
California. The Solar Shade Control Act, signed by the governor in 1978, bans trees or
shrubs
from shading more than 10 percent of a neighbor's solar panels between 10 a.m. and 2 p.m.
and
includes shading on panels installed after the trees were planted if the trees grow to such a
height
to produce shade which exceeds that which is allowed by the law. A recent celebrated case
invoking that law involves neighbors in a community near San Francisco. Neighbor A
planted
eight redwood trees, B, between 1997 and 1999. Neighbor C installed a 10 kW photovoltaic
solar panel system, C, in 2001. Redwood trees, B, grew until their shade, D, exceeded that
which is allowed by the Solar Shade Control Act. In December 2007, Santa Clara County
Superior Court Judge Kurt Kumli ruled that six of the trees can remain and that the two
generating the most shade must be removed. It was reported on July 23, 2008 by KGO-TV
that
Governor Schwarzenegger has settled the conflict by signing a bill which states that a tree
which
casts a shadow onto a neighbor's solar panel will no longer have to be cut down, as long as
the
trees were planted before the panels were installed.
The shading of one's solar panels by a neighbor's trees can rise to a litigious level if one lives
in
California. The Solar Shade Control Act, signed by the governor in 1978, bans trees or
shrubs
from shading more than 10 percent of a neighbor's solar panels between 10 a.m. and 2 p.m.
and
includes shading on panels installed after the trees were planted if the trees grow to such a
height
to produce shade which exceeds that which is allowed by the law. A recent celebrated case
invoking that law involves neighbors in a community near San Francisco. Neighbor A
planted
eight redwood trees, B, between 1997 and 1999. Neighbor C installed a 10 kW photovoltaic
solar panel system, C, in 2001. Redwood trees, B, grew until their shade, D, exceeded that
which is allowed by the Solar Shade Control Act. In December 2007, Santa Clara County
Superior Court Judge Kurt Kumli ruled that six of the trees can remain and that the two
generating the most shade must be removed. It was reported on July 23, 2008 by KGO-TV
that
Governor Schwarzenegger has settled the conflict by signing a bill which states that a tree
which
casts a shadow onto a neighbor's solar panel will no longer have to be cut down, as long as
the
trees were planted before the panels were installed.
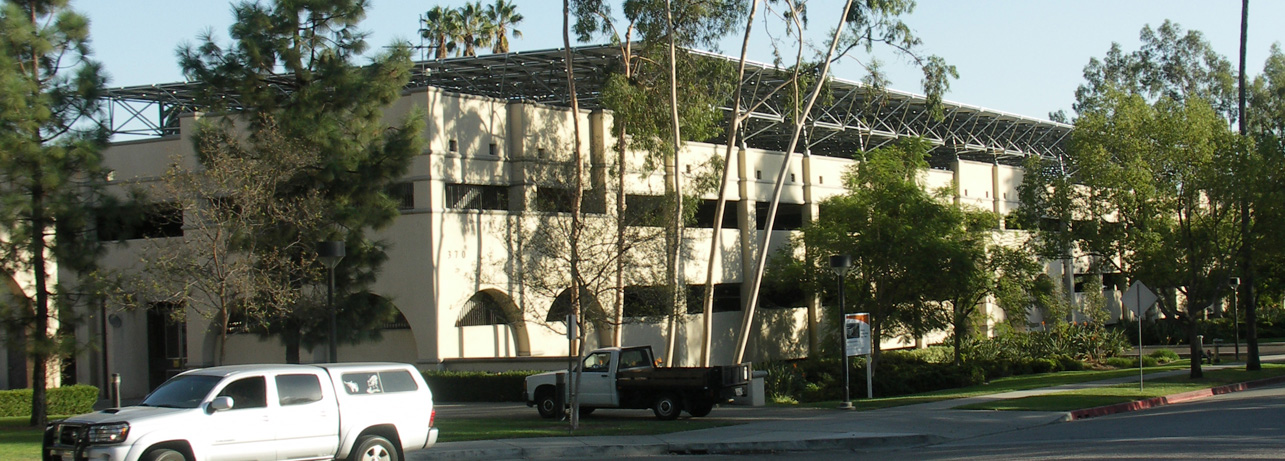
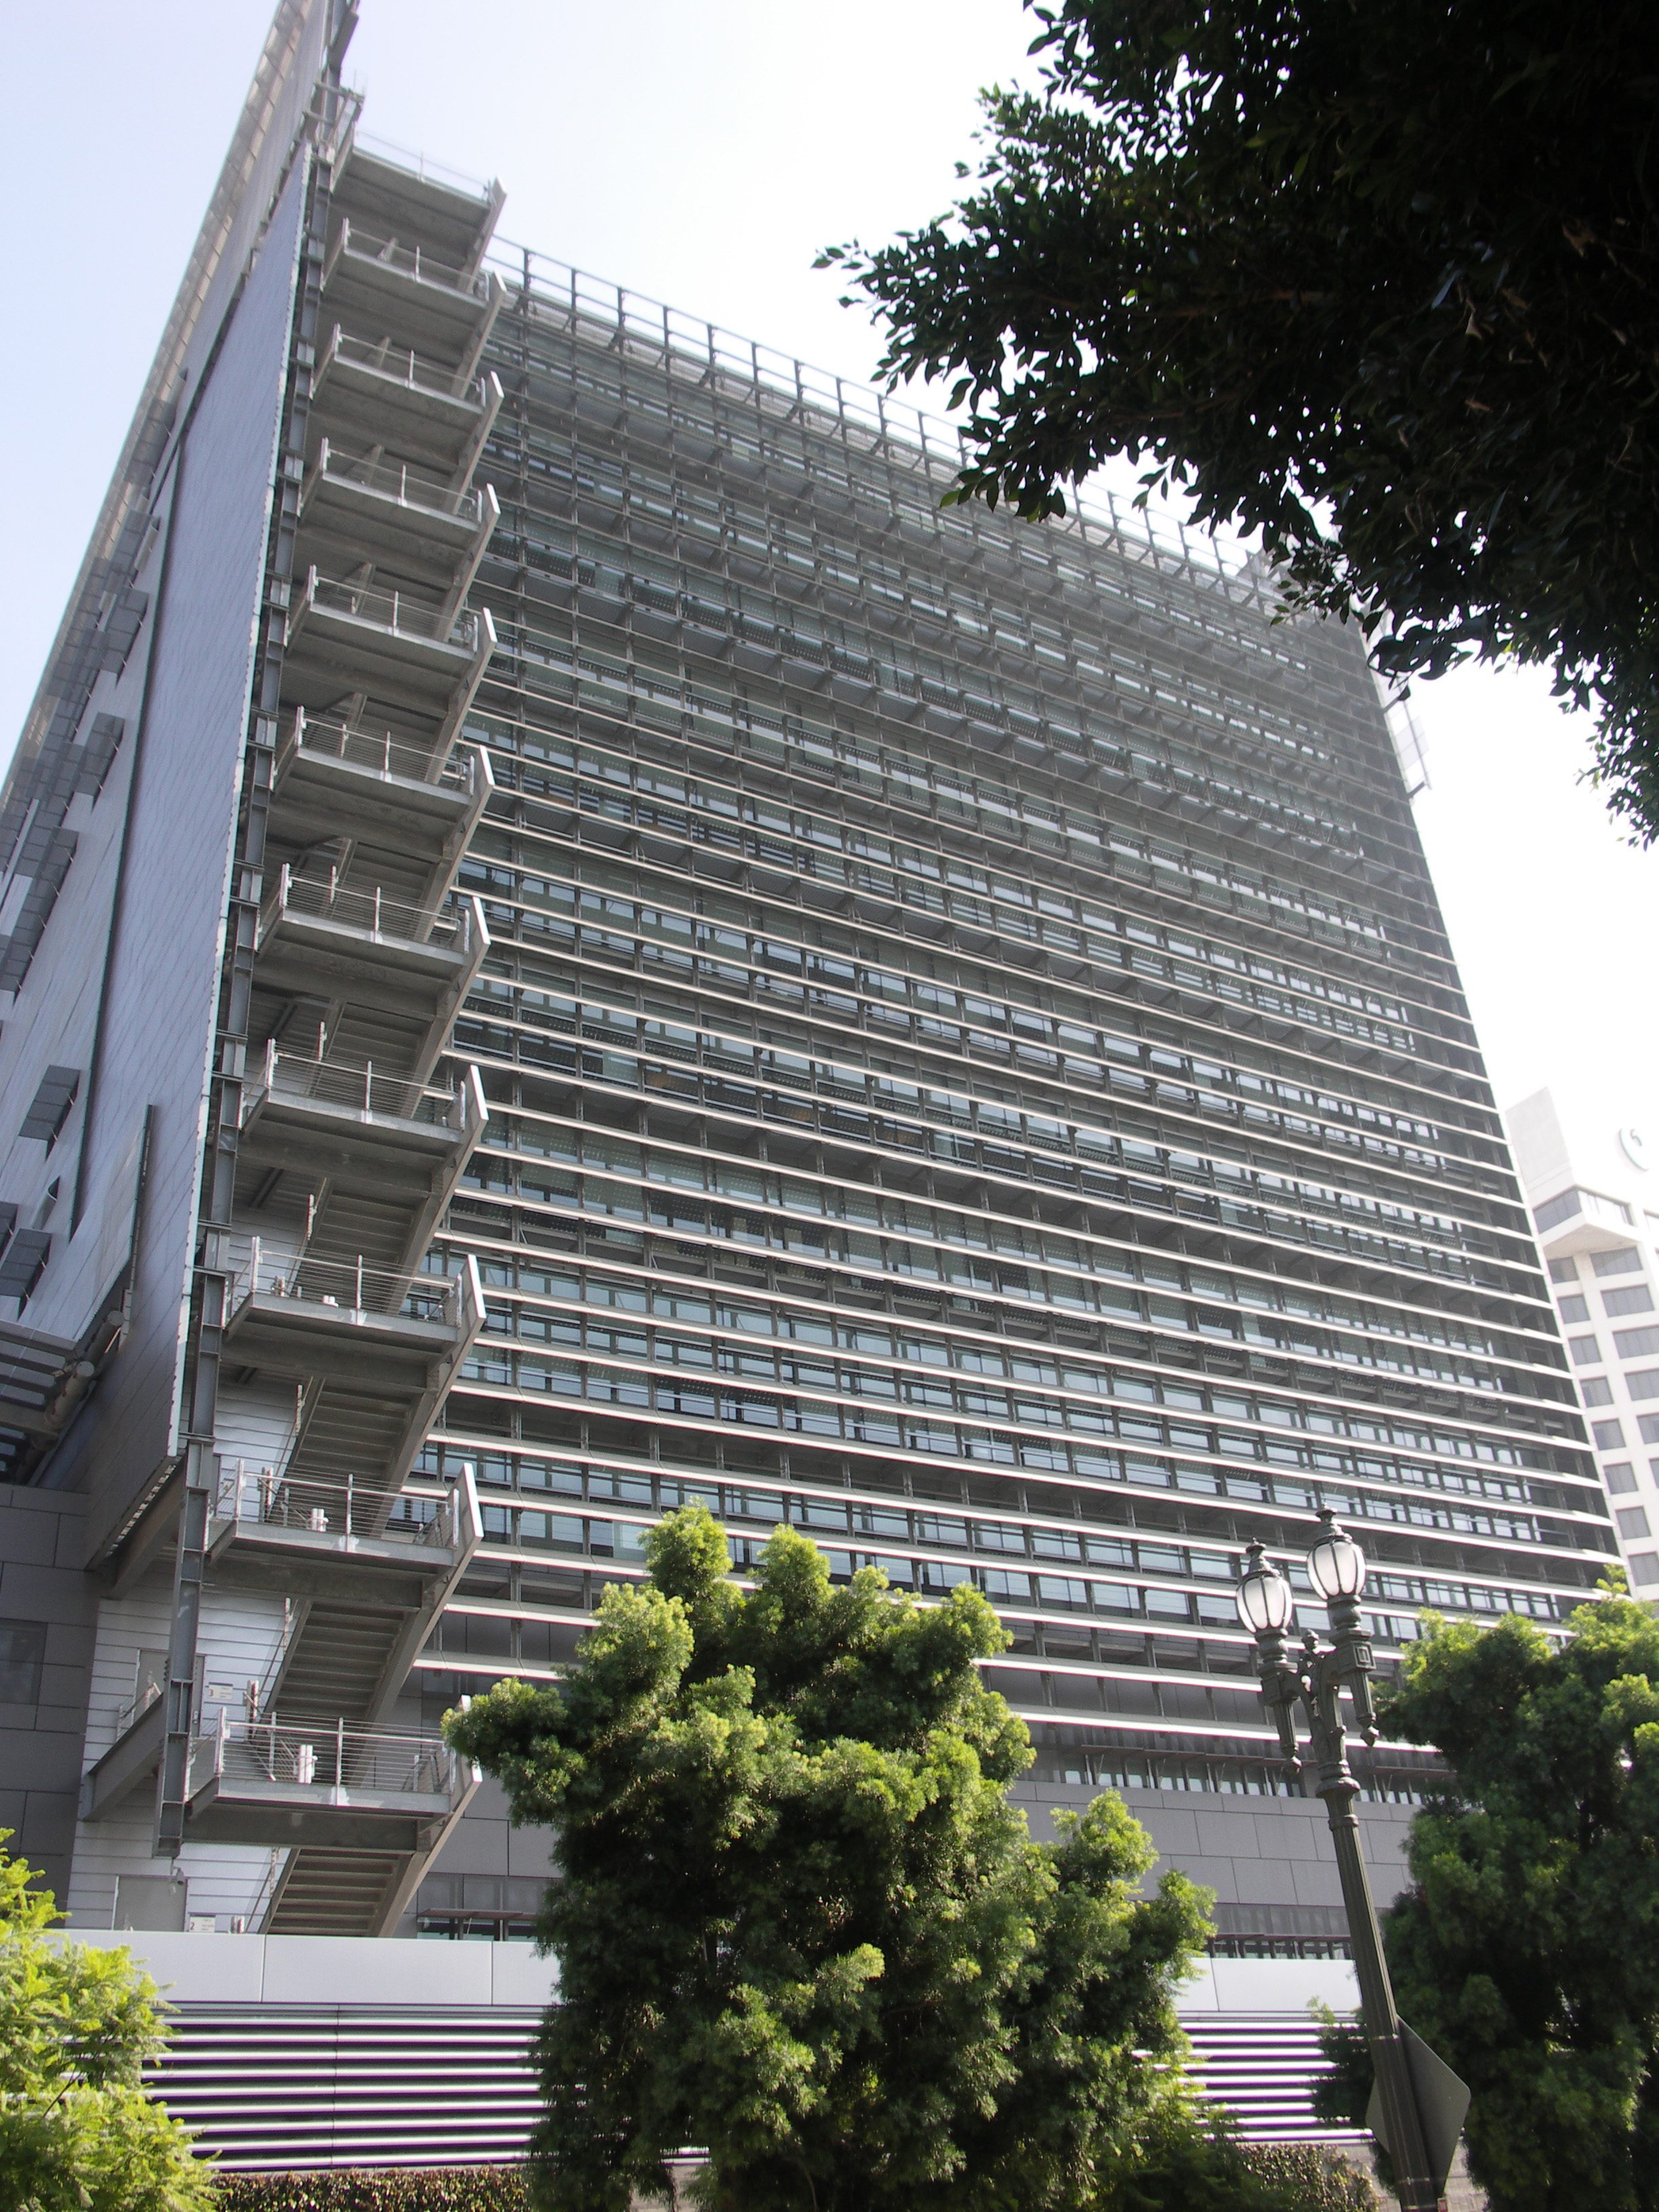 The California Department of Transportation building in Los Angeles (right) has a system of
panels sandwiched in a casing of bullet-proof glass on the south face, but notice in the
close-up
The California Department of Transportation building in Los Angeles (right) has a system of
panels sandwiched in a casing of bullet-proof glass on the south face, but notice in the
close-up
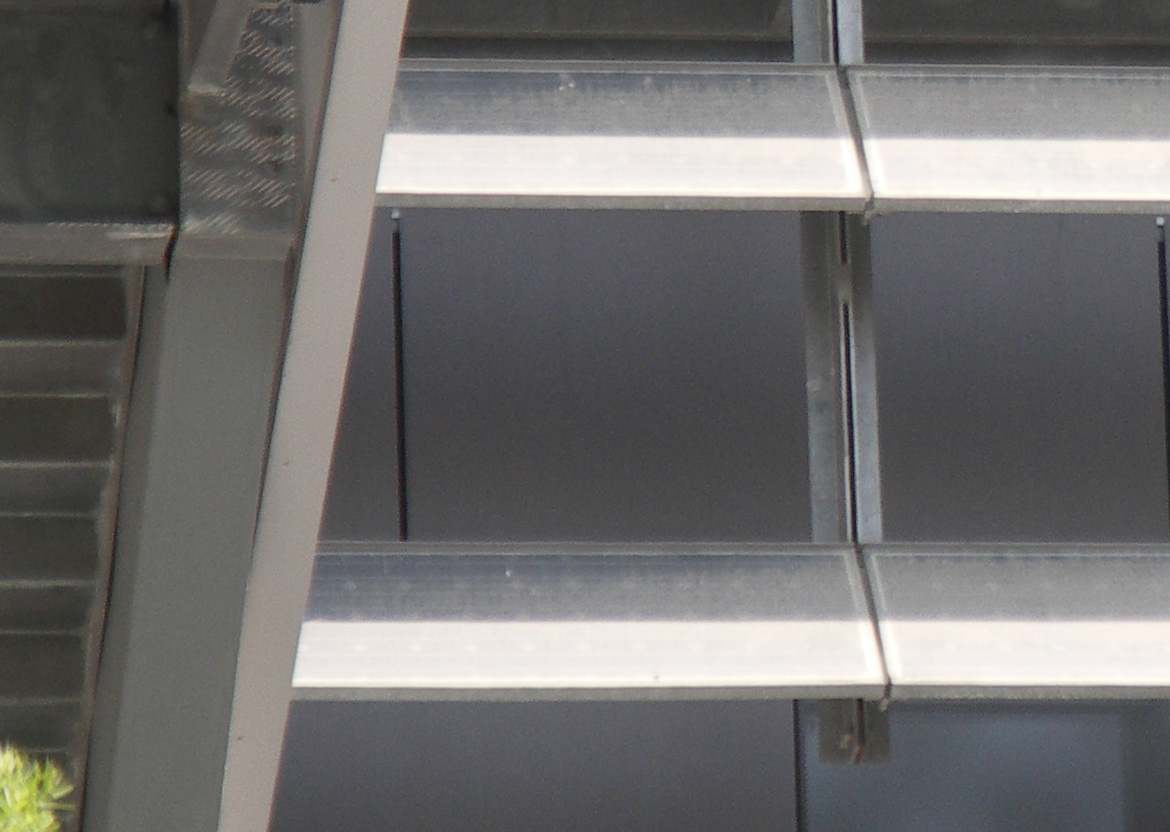 that each rank of panels shadows the one below. Moreover, there is no cleaning schedule for
the
glass surface. If one could depend on frequent inundations blowing from the south then these
panels would be periodically cleaned, but that kind of weather doesn't often happen in
southern
California. We have lengthy periods without rain and when the storms do come they're more
often in the form of vertical drizzles which will very definitely clean the uppermost rank of
panels
but do little good for the ones below.
that each rank of panels shadows the one below. Moreover, there is no cleaning schedule for
the
glass surface. If one could depend on frequent inundations blowing from the south then these
panels would be periodically cleaned, but that kind of weather doesn't often happen in
southern
California. We have lengthy periods without rain and when the storms do come they're more
often in the form of vertical drizzles which will very definitely clean the uppermost rank of
panels
but do little good for the ones below.
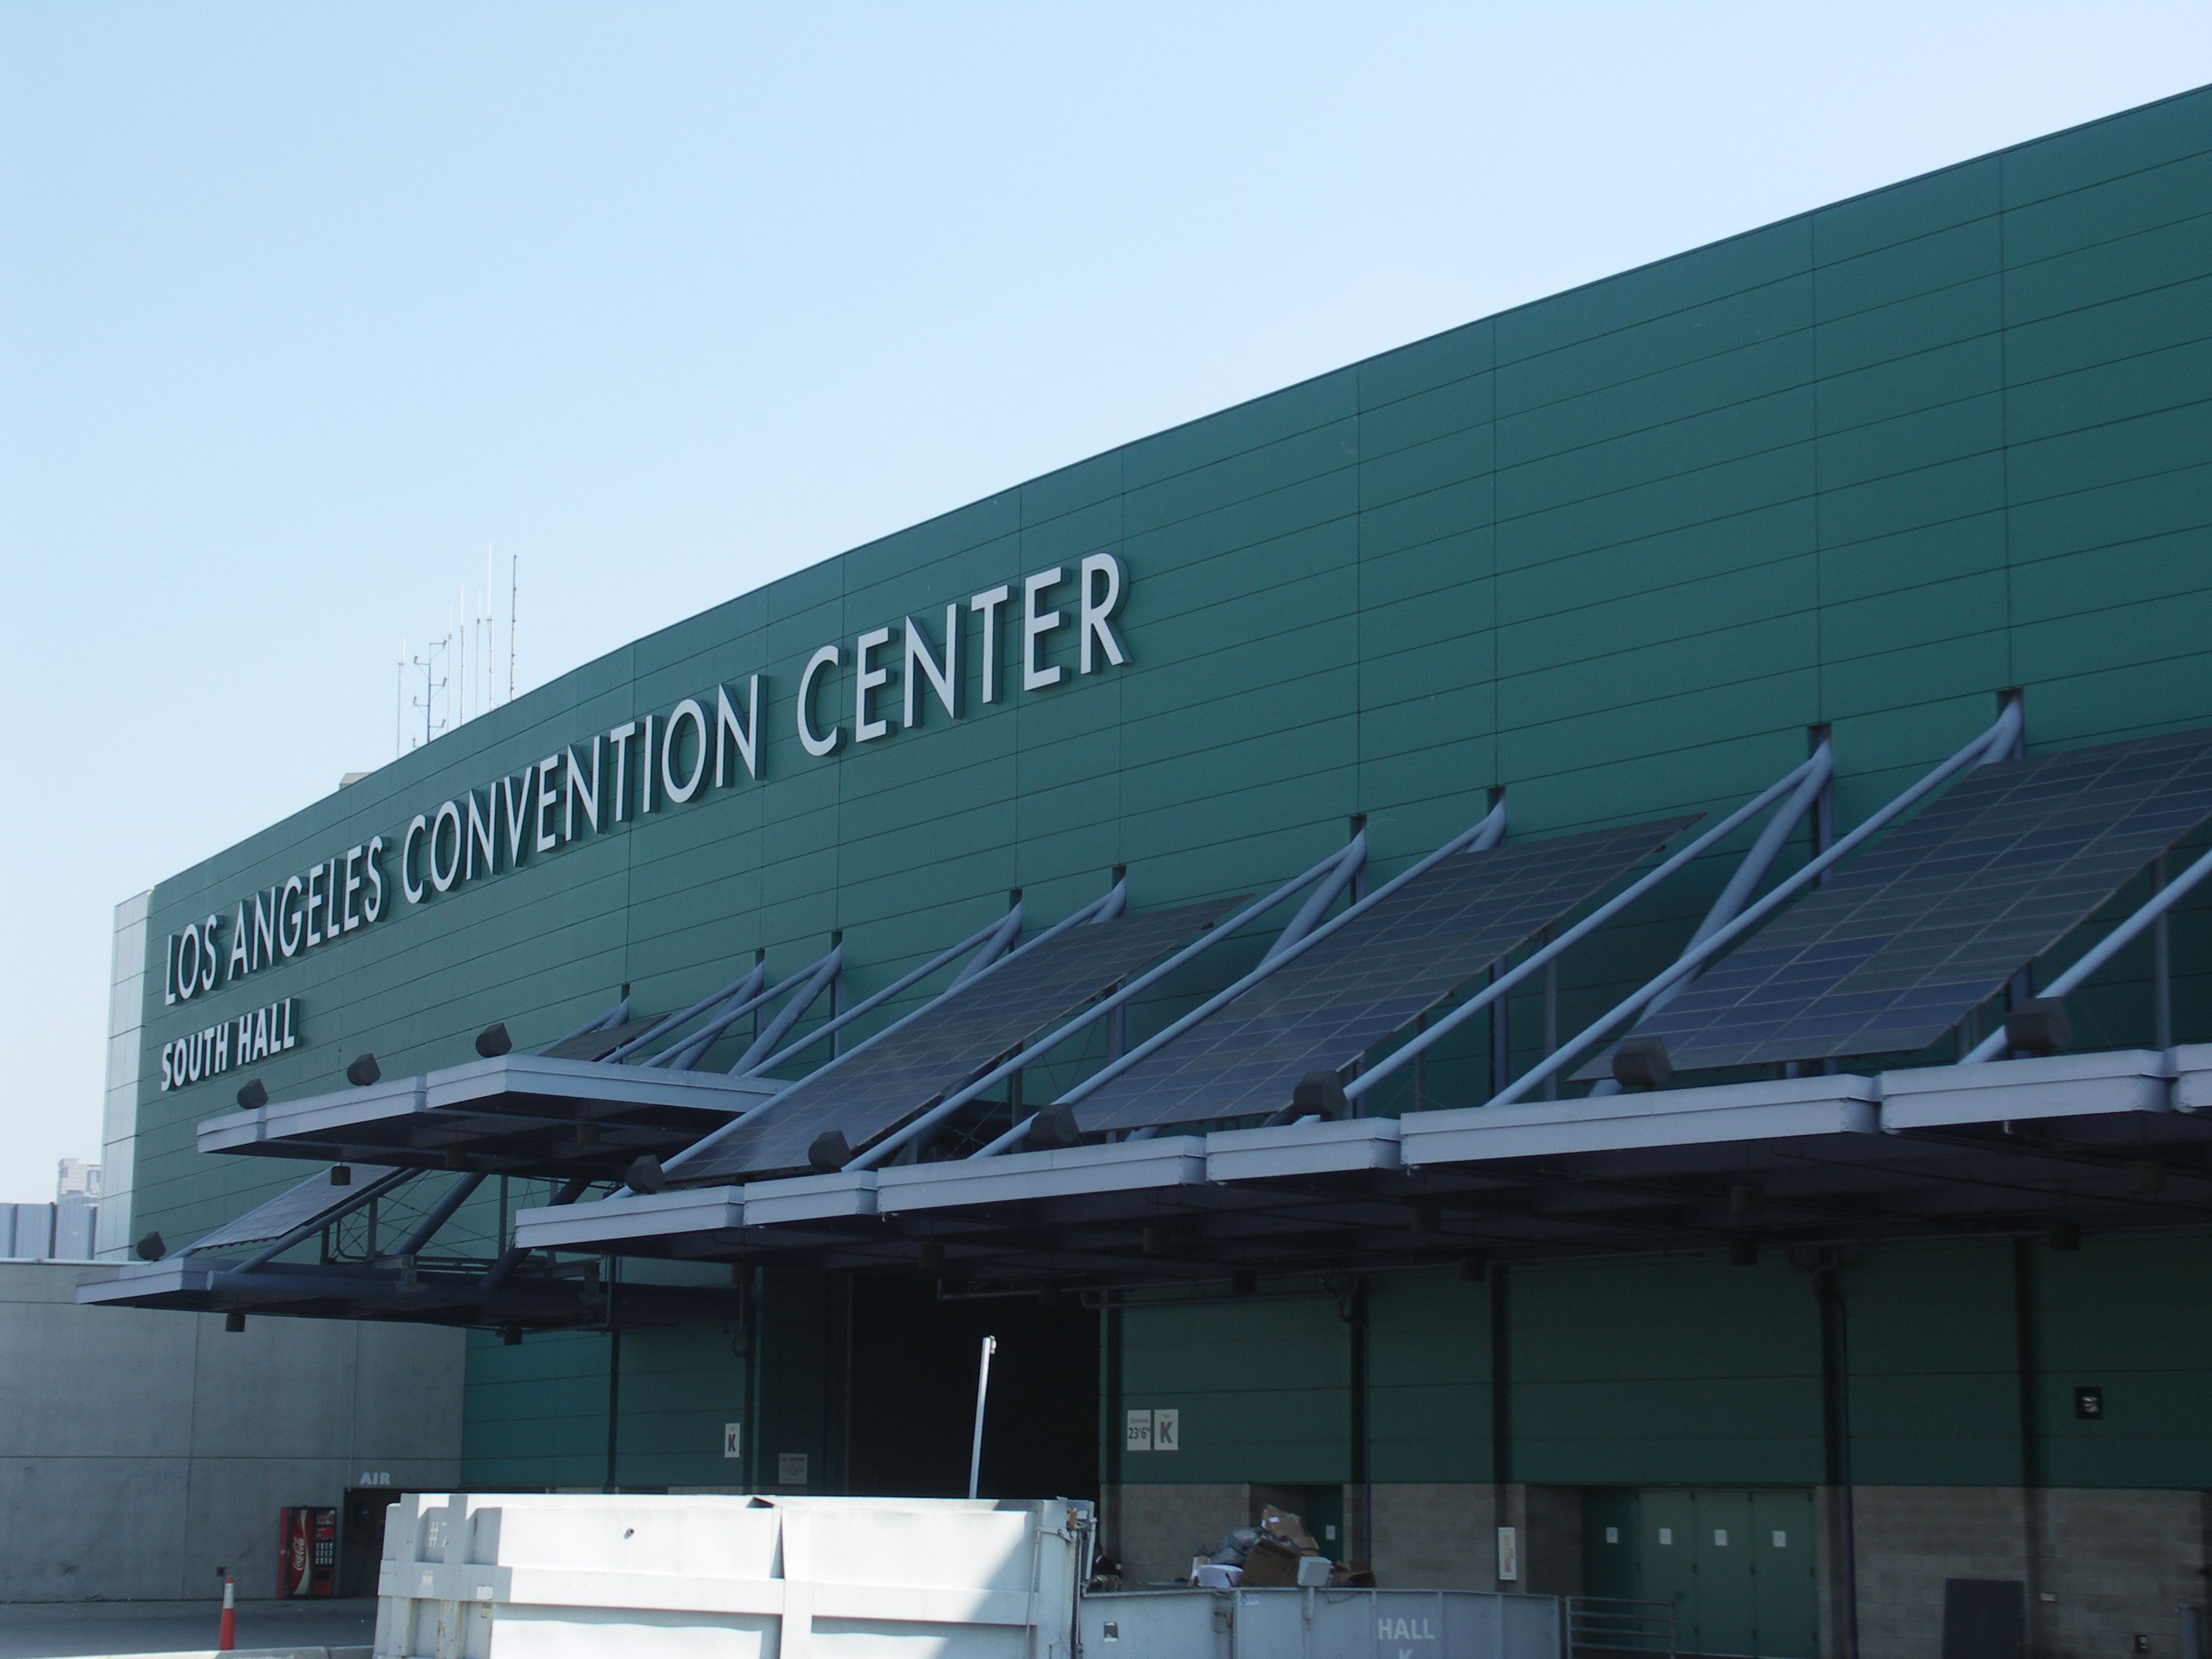 The Los Angeles Convention Center has a system which was installed by the L.A.
Department of
Water and Power. The panels were placed around the periphery of the building well below
the
roof
line (I would estimate 4-7 meters). The panels which are mounted on the east and west sides
receive no direct sunlight for about
half of each day. The ones mounted on the west side and shown in the photograph at the right
are
in the shade until early afternoon.
The Los Angeles Convention Center has a system which was installed by the L.A.
Department of
Water and Power. The panels were placed around the periphery of the building well below
the
roof
line (I would estimate 4-7 meters). The panels which are mounted on the east and west sides
receive no direct sunlight for about
half of each day. The ones mounted on the west side and shown in the photograph at the right
are
in the shade until early afternoon.
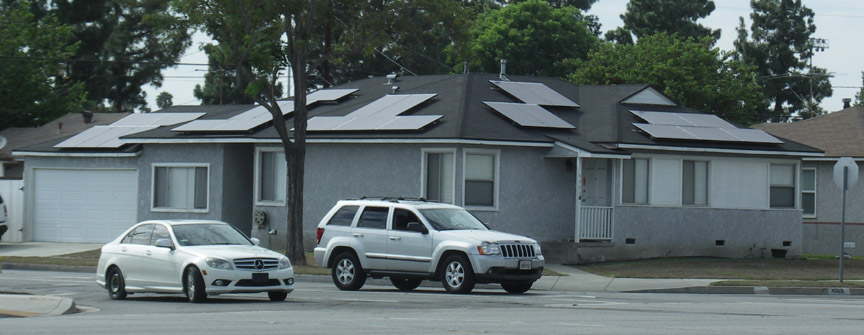 On the other hand, a student recently asked me if possibly the installation was set up to
overcome the architectural limitations of the building and to take advantage of sunlight
during certain hours of the day. PV panels in the early days were expensive and such an
installation would hardly have made sense, but one reads that there has been a 50% drop in
the price of PV panels so people more and more may simply be of a mind to put the panels
wherever there is space, regardless of disadvantages of tilt or shading. Here is an installation
in Lakewood, California where panels are placed flat against eastern and southern sloping
roof surfaces, where each set of panels will produce electrical energy at highest yield at
different times. The leaves of the tree on the southern side in the foreground will likely
produce problems of shading at certain hours.
On the other hand, a student recently asked me if possibly the installation was set up to
overcome the architectural limitations of the building and to take advantage of sunlight
during certain hours of the day. PV panels in the early days were expensive and such an
installation would hardly have made sense, but one reads that there has been a 50% drop in
the price of PV panels so people more and more may simply be of a mind to put the panels
wherever there is space, regardless of disadvantages of tilt or shading. Here is an installation
in Lakewood, California where panels are placed flat against eastern and southern sloping
roof surfaces, where each set of panels will produce electrical energy at highest yield at
different times. The leaves of the tree on the southern side in the foreground will likely
produce problems of shading at certain hours.
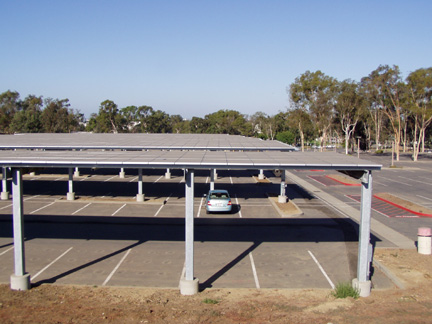
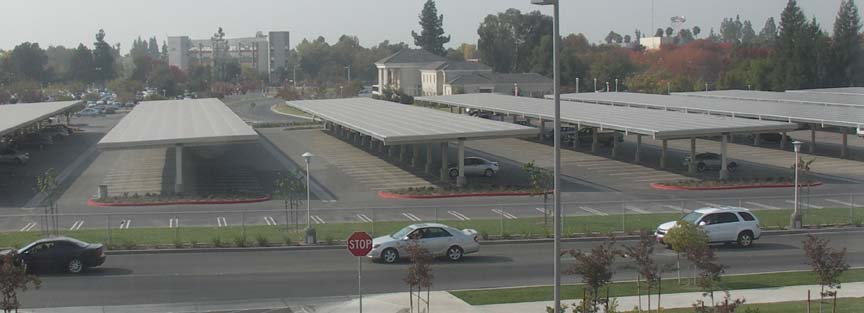 A system consisting of 3872 300 watt panels (Schott ASE-300-DGF/50) yielding a rated
power
output of 1162 kilowatts was recently installed on the
campus of CSU Fresno over Parking Lot V. The general contractor for this installation was
Chevron Energy Solutions. The owner of the panels is MMA Renewable Ventures with
which
the campus has entered into a 20-year power purchase agreement at a starting rate of $0.16
per
kilowatt hour and a 2% annual inflation adjustment. An examination of current rates paid by
big
users of electricity makes a rate of $0.16 per kilowatt hour appear to be a bit pricey. Note that
there seems to be
a slight tilt toward the south of 1-2 degrees, possibly with drainage in mind.
A system consisting of 3872 300 watt panels (Schott ASE-300-DGF/50) yielding a rated
power
output of 1162 kilowatts was recently installed on the
campus of CSU Fresno over Parking Lot V. The general contractor for this installation was
Chevron Energy Solutions. The owner of the panels is MMA Renewable Ventures with
which
the campus has entered into a 20-year power purchase agreement at a starting rate of $0.16
per
kilowatt hour and a 2% annual inflation adjustment. An examination of current rates paid by
big
users of electricity makes a rate of $0.16 per kilowatt hour appear to be a bit pricey. Note that
there seems to be
a slight tilt toward the south of 1-2 degrees, possibly with drainage in mind.
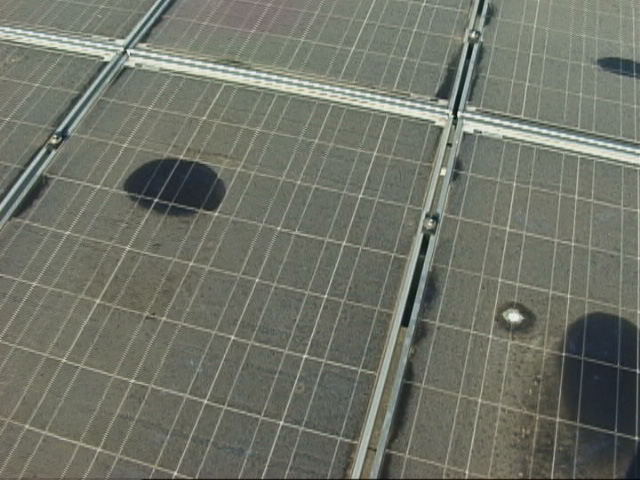
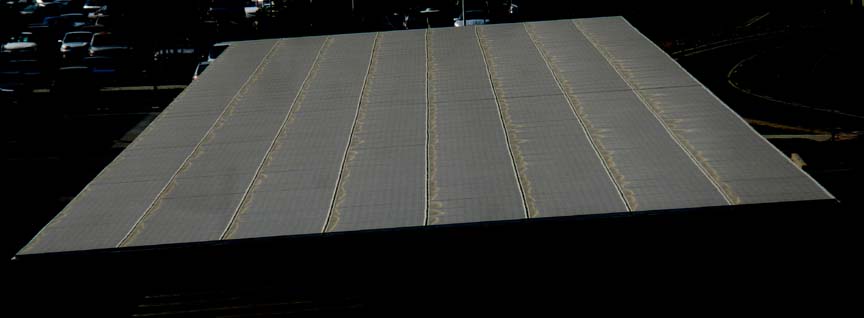 However, in the image at the right which has had its brightness reduced and contrast
increased, the effect of such drainage where morning dew and occasional drizzles are the only
sources of precipitation for
several months running is
a distinct residue which builds up over the cells at the lowest elevation of each set of panel
segments. It is not clear at this writing if there is a program of routine rinsing in place.
However, in the image at the right which has had its brightness reduced and contrast
increased, the effect of such drainage where morning dew and occasional drizzles are the only
sources of precipitation for
several months running is
a distinct residue which builds up over the cells at the lowest elevation of each set of panel
segments. It is not clear at this writing if there is a program of routine rinsing in place.
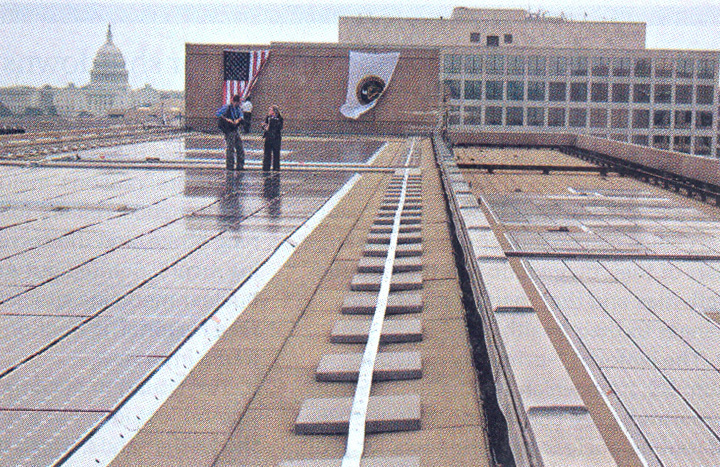 Here's one worth mentioning. This 205 kilowatt array is in Washington, D.C. and is said to
comprise 891 230 W solar panels. Sure enough, 891 x 230 / 1000 = 204.93 kilowatts. But
Washington, D.C. is at latitude 38 o 53' north which means that at the very
best,
the rated power output of horizontal panels will be attenuated by an average factor of
Here's one worth mentioning. This 205 kilowatt array is in Washington, D.C. and is said to
comprise 891 230 W solar panels. Sure enough, 891 x 230 / 1000 = 204.93 kilowatts. But
Washington, D.C. is at latitude 38 o 53' north which means that at the very
best,
the rated power output of horizontal panels will be attenuated by an average factor of
cosine(38
o 53') = 0.78 , decreasing the figure above to 159.6 kilowatts. Judging from the
image at the right, it would appear that there isn't
the slightest indication of tilt so as to allow the panels to self-clean in the annual rainfall of
39.3
inches. (100 cm). The average solar energy in Washington, D.C. is about 73% that of
southern
California, so it could be argued that horizontal panels will gain a little from the diffuse
sunlight
through the frequent cloud cover over Washington, D.C., but most likely the gain will be
more
than
offset by the loss due to the lack of tilt on sunny days. Moreover, one would expect the
dustfall
on these panels
to turn to mud on the surface, not unlike some of the other examples in this section, until the
panel guys
arrive to give them a power rinse. Where is this ill-conceived installation, I hear you ask? It
is
on
the roof of the headquarters of the . . . wait for it . . . U.S. Department of Energy.
 This installation may be found above the top level of a parking structure on Holliston Avenue
at
Caltech in Pasadena, California. It consists of 1404 170 watt Suntech STP170S-24/Ab-1
panels,
giving a
total rated power output of 238.68 kilowatts. The sign in the photo at the driveway claims
199
kilowatts. It was installed by EI Solutions. Note that the
panels are mounted horizontally. What is not clear from the image is that the only practical
access
to the panels for periodic rinsing would have to be by hydraulic lift on the east and west sides.
The installation runs nearly the length of the structure and the limited access to the panel
surface
at the north and south ends would make periodic rinsing of the entire panel surface
impractical
from those access points. A representative of Suntech Energy Solutions points out that
where
the realization of installations such as this, including the execution of "power purchase
agreements" by investor groups, are concerned, optimizing energy output is only one of a
variety
of considerations. The others are the level and conditions of any production rebate,
time-of-use
energy tariffs by the electrical utility, financing requirements for the area available and the
stated
objectives of the client. That is, given the sometimes conflicting agendas encountered when
putting together an investor group to realize an installation such as this, other exigencies have
to
be considered.
This installation may be found above the top level of a parking structure on Holliston Avenue
at
Caltech in Pasadena, California. It consists of 1404 170 watt Suntech STP170S-24/Ab-1
panels,
giving a
total rated power output of 238.68 kilowatts. The sign in the photo at the driveway claims
199
kilowatts. It was installed by EI Solutions. Note that the
panels are mounted horizontally. What is not clear from the image is that the only practical
access
to the panels for periodic rinsing would have to be by hydraulic lift on the east and west sides.
The installation runs nearly the length of the structure and the limited access to the panel
surface
at the north and south ends would make periodic rinsing of the entire panel surface
impractical
from those access points. A representative of Suntech Energy Solutions points out that
where
the realization of installations such as this, including the execution of "power purchase
agreements" by investor groups, are concerned, optimizing energy output is only one of a
variety
of considerations. The others are the level and conditions of any production rebate,
time-of-use
energy tariffs by the electrical utility, financing requirements for the area available and the
stated
objectives of the client. That is, given the sometimes conflicting agendas encountered when
putting together an investor group to realize an installation such as this, other exigencies have
to
be considered.
 A Case Study
A large system (557 kW) was recently installed on the campus of CSU Dominguez Hills by
Sun
Edison. There are 3279 panels, each rated at 170 watts, bringing the
maximum rated power output to 557,430 watts or 557.43 kilowatts. The
panels have been mounted nearly horizontally over Parking Lot 1. At our latitude of 34
degrees
north they ought to
have been tilted toward the south by 34 degrees if the objective is to maximize the generation
of
energy. At noon at our latitude on the summer solstice the sun is
10.5 degrees from
the vertical. At noon on the winter solstice it is 57.5 degrees from the vertical. Assuming 0%
loss if the panels are pointing directly at the sun, horizontal panels suffer a power loss of
1.7%
and 46.3% at noon on the summer and winter solstices, respectively, for an average annual
loss
of
24%. On the other hand, under Time of Use (TOU) billing (discussed above), the On-peak
period
is from 10am to 6pm when the rate charged is higher and if the objective is to maximize one's
$
credit the panels ought to be tilted appropriately in a southwesterly direction. Even though
we
often get brilliant sunlight in southern California from 7am to 10am, that time period still
falls in
the category of Off-peak.
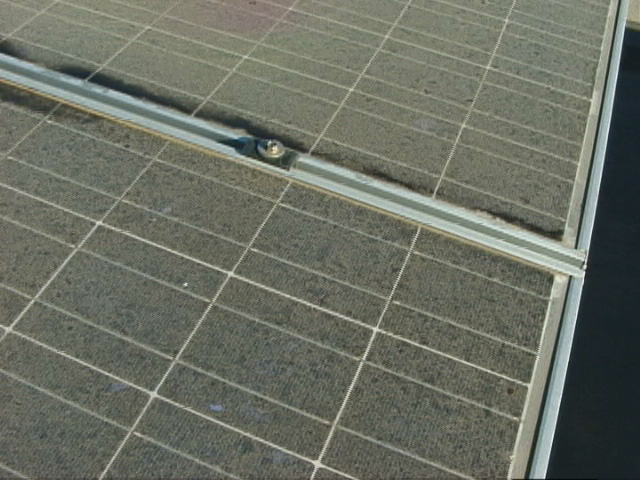 But it gets worse than that. The lack of tilt means that there is no natural
gravity runoff for rain or rinse water. If it appears to you that from the acute angle of view in
the
photo above the surface color is
something other than the typical metallic blue of a silicon photovoltaic cell, you would be
right.
It
appears (at this writing in the fall of 2006) that there has been no rinsing service to maintain
maximum output.
The surface has been allowed to collect the dustfall of greater Los Angeles since installation
around
four months ago during which time there has been no rainfall. It is
not clear at this writing what the dark spots in the middle of several of the panels represent,
but
the buildup of dirt certainly doesn't bode well for the overall output of the panel array. It is
also
not clear at this writing who suffers the greatest disadvantage (the university or the power
company) if the power output drops
significantly due to lack of maintenance. Only knowledge of the specific billing arrangement
worked out in the contract would reveal that information.
But it gets worse than that. The lack of tilt means that there is no natural
gravity runoff for rain or rinse water. If it appears to you that from the acute angle of view in
the
photo above the surface color is
something other than the typical metallic blue of a silicon photovoltaic cell, you would be
right.
It
appears (at this writing in the fall of 2006) that there has been no rinsing service to maintain
maximum output.
The surface has been allowed to collect the dustfall of greater Los Angeles since installation
around
four months ago during which time there has been no rainfall. It is
not clear at this writing what the dark spots in the middle of several of the panels represent,
but
the buildup of dirt certainly doesn't bode well for the overall output of the panel array. It is
also
not clear at this writing who suffers the greatest disadvantage (the university or the power
company) if the power output drops
significantly due to lack of maintenance. Only knowledge of the specific billing arrangement
worked out in the contract would reveal that information.
Do real data support the depressing conclusion expressed above? Well, yes, generally. On
February 28, 2007, a cloudless day from 10am to early afternoon, the system on our rooftop
peaked at 10:51 am with an average power output of 2271 watts over the 15 minute interval
(7
minutes on either side) which bracketed the maximum of 2284 watts. Taking the theoretical
maximum power output specification of these panels, the 2271 watt average translates to
[2271/(18 x 165)]x100 = 76.5%. On that same day the power of the university system peaked
at
12:15 pm, showing a power output of 319,841 watts. Carrying out an equivalent calculation
one
gets
[318,841/(3279 x 170)] x 100 = 57.4%, a value diminished, I would offer, by the lack of tilt
of
the panels at the angle of our latitude. We are stymied at this point from looking more closely
at
these figures and trying to establish how much the diminished value is caused by the lack of
tilt
and how much by dustfall because the tilt of the domestic roof-top system is itself not ideal.
One
would need to observe the output of at least one 170 watt panel the normal vector of which is
pointing directly at the sun at the time of maximum power by the array of 3279 panels to
establish
a credible attenuation of power owing both to tilt as well as dustfall.
Here is the one-year line chart of energy generated vs. date for the university
system.
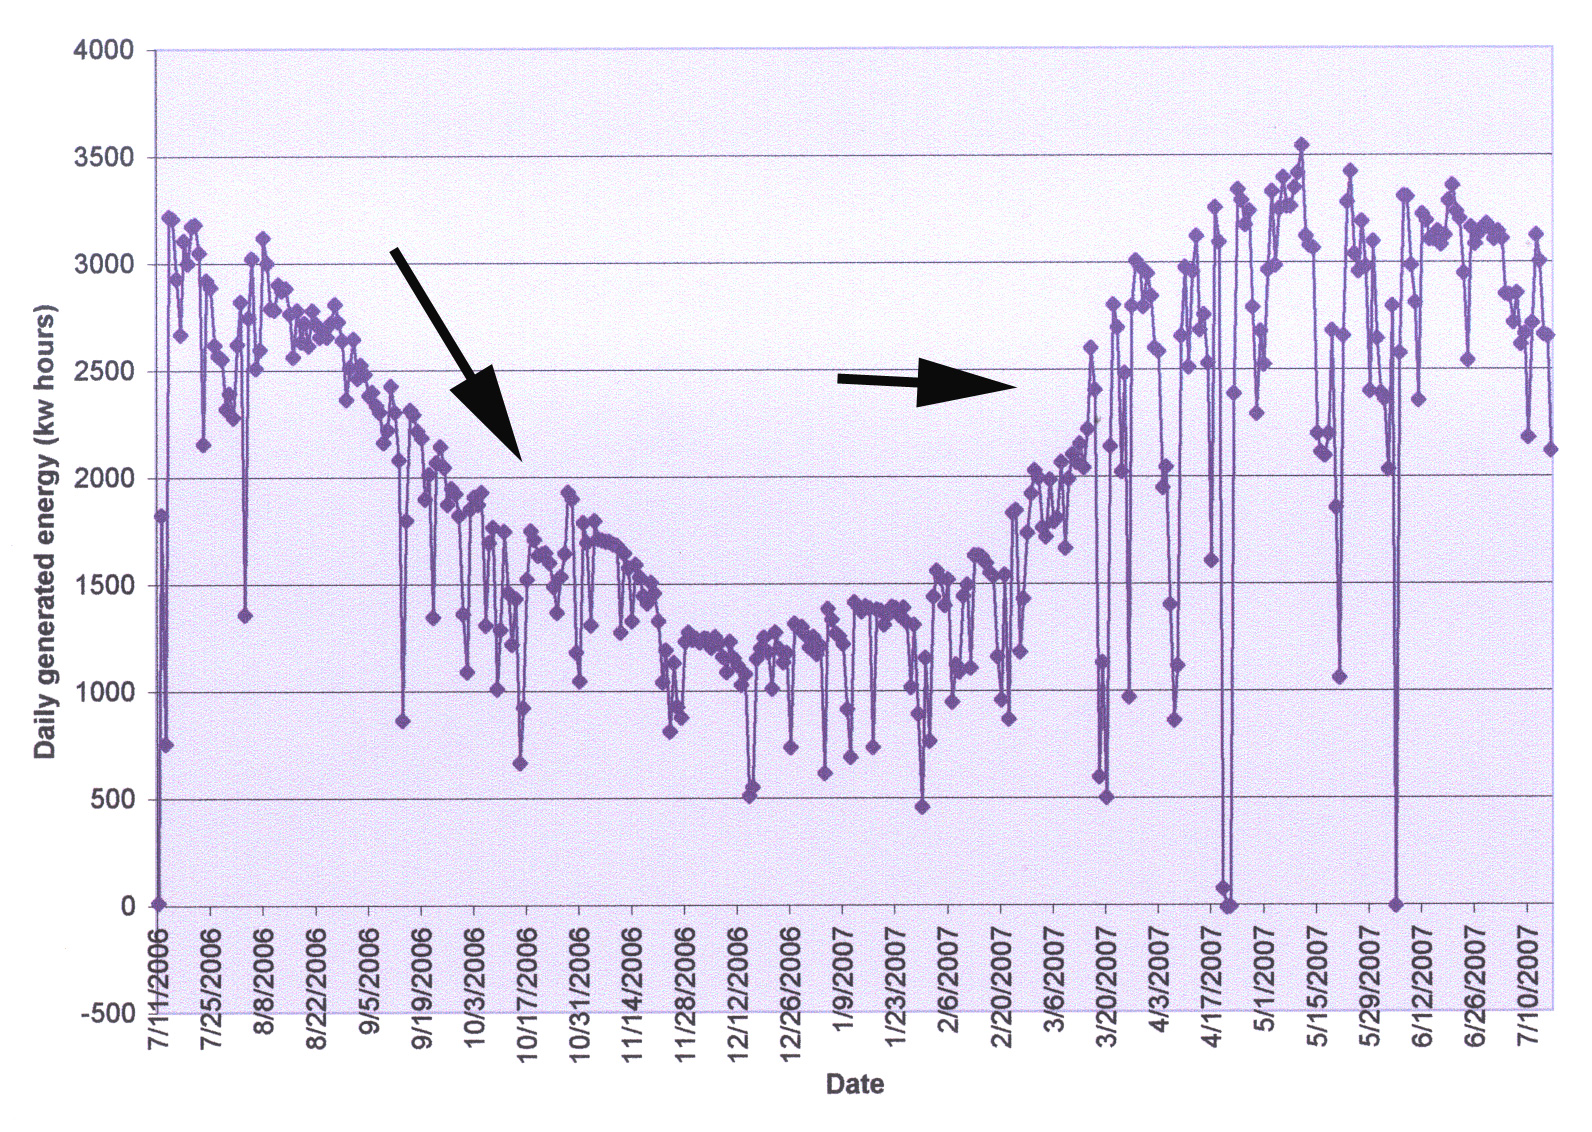
Note the two discontinuities identified by the arrows. They represent the increased output
following rinsing. That we are experiencing the driest year since records have been kept
starting
in the latter part of the nineteenth century, we've had many cloudless days. All maxima on
the
chart above are representative of energy output on cloudless days. Taking the highest
adjacent
maxima before and after cleaning, we have 10/27/2006 and 10/28/2006, 1644 kwh and 1930
kwh.
The lower value is 85.2% of the upper value. Again on 3/15/2007 and 3/16/2007 we have
2222
kwh and 2599 kwh respectively. The low value is 85.5% of the higher value, suggesting that
the
event which triggers rinsing by the maintenance crew is a 15% drop from maximum expected
value. The very low energy outputs and those at zero are unexplained. They are either
outages of the panel system for part or all of the day or there was a failure of the data
collection
system. No explanation is available at this writing.
Photovoltaic Panels, a Game Changer?
In urban southern California it isn't unusual to see oil derricks pumping petroleum near
private residences like the one shown here.
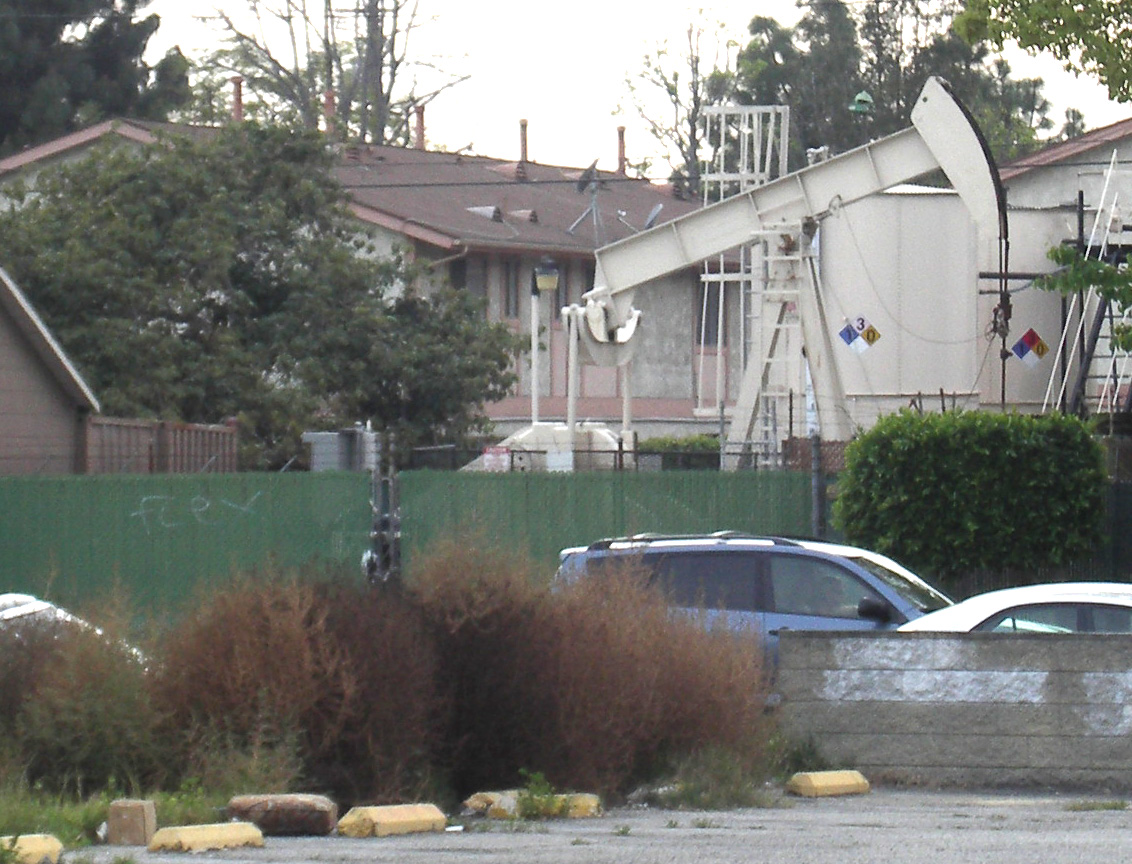 The owners of the pumped oil almost certainly are NOT the residents of any of the
surrounding houses because the mineral rights of the neighborhood were bought decades ago.
But how about a rooftop solar installation which produces energy whether you are at home, at
work or on a holiday. It keeps pumping energy, just like the oil derrick but there is no
drilling, no spills, no damage to the environment and no purchase of mineral rights are
necessary. Give it some thought.
The owners of the pumped oil almost certainly are NOT the residents of any of the
surrounding houses because the mineral rights of the neighborhood were bought decades ago.
But how about a rooftop solar installation which produces energy whether you are at home, at
work or on a holiday. It keeps pumping energy, just like the oil derrick but there is no
drilling, no spills, no damage to the environment and no purchase of mineral rights are
necessary. Give it some thought.
Things we haven't covered
1. Leasing arrangements.
We have one family member who has installed panels on a leasing arrangement. I asked him
to give me a testimonial about his experience. I would offer that his approach probably points
the way to the future. Very few folks want to be managers of their own private electric utility
unless they can figure out a way to be compensated handsomely. Here is what he writes:
Leasing solar panels
This was an easy decision to make. Since I'm leasing them that means the company owns
them and has to service them. If power drops below the specified minimum, it's up to them
to figure out why. Sure, I could have taken on this responsibility and gotten a higher value
from the panels but the cost was my time. And right now time is something I do not have
much to spare, so I value it EXTREMELY highly. So far there have been no problems with
my panels and they just keep churning out money.
2. Community solar farms. An estimated 85 percent of US residents can neither own nor
lease systems because their roofs are physically unsuitable for solar or because they live in
multi-family housing. If you are one of the 85% then a community solar farm may be for you.
Read all about it at
Community Solar
Farm
3. Plug-in panels.
4. Microinverters
5. Disconnecting from the grid using battery-based energy storage.
Things we have covered only briefly.
1. Feed-in tariff. Search the web for an explanation.
2. Net metering. Search the web for an explanation.
Conclusion
So as to gain maximum advantage from an installed system of photovoltaic panels, the
following
preliminary conclusions can be made:
1. If you are connected to a grid, install a system sufficiently large to generate as much energy
in kilowatt hours as you use during the entire year. Even that strategy might have to be
modified if the on-peak rate changes to be highest at night. In any case, you need to start
thinking about a Plan B to use up the energy credit you build up throughout the year and
possibly to install more panels if you find yourself suddenly having to pay for electricity.
2. Tilt your panels toward the south (in the northern hemisphere) or toward the north (in the
southern hemisphere) at the angle of your latitude.
3. Regularly rinse your panels to keep them clean and to maximize their output.
4. If the panels meet all of your electrical energy needs, that is, if energy consumption is close
to energy generation, then the decision to switch to "Time of Use" metering makes sense only
if the Winter Off Peak rate is so much lower than the Summer On Peak rate that some Plan B
for using up the accrued credit becomes financially appealing.
5. Don't opt for "Time of Use" metering if your panels produce somewhat less than your
electricity requirement during the winter, but more than you use during the summer because a
slight change in rate of one period vs. another can make the difference between an annual
energy credit and an unwelcome electricity bill.
6. If your panels produce only a small fraction of the electrical energy you use throughout the
year then do NOT switch to TOU metering. Doing so would subject you to the inflated
"Summer On Peak" rate which at this writing is on the order of three times the flat rate.
Send a message to Oliver about this page?
Click here.